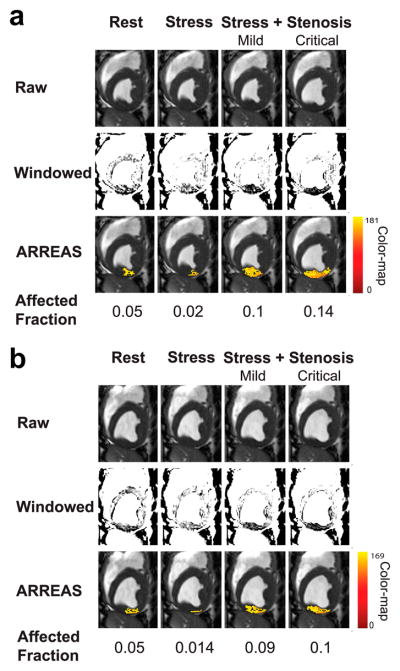
Figure 3.
Visualization of the BOLD effect in raw, manually windowed, and images processed using ARREAS method obtained from a canine at various physiological states (rest, stress, and stress with LCX stenosis of various grades) are shown for end-systole (a) and end-diastole (b). For each case, the rest and adenosine stress (absence of stenosis, and with mild or critical stenosis) are shown left to right. The top row shows the raw images. The middle row shows the same images after manual windowing, permitting visualization of the affected (LCX) territory as regions of hypointensity. The bottom row shows the raw images that have a color overlay (generated by ARREAS) facilitating the depiction of the affected territory. The pixel intensity color-map is also shown on the right. The corresponding Affected Fraction (AF) values are shown directly below the images. Observe the close correspondence between the automatically detected (colored) regions and the hypointense regions on the windowed images in the LCX territory. The variations of red and yellow hues are consistent with alteration in BOLD signal intensity variations within the affected territory.

