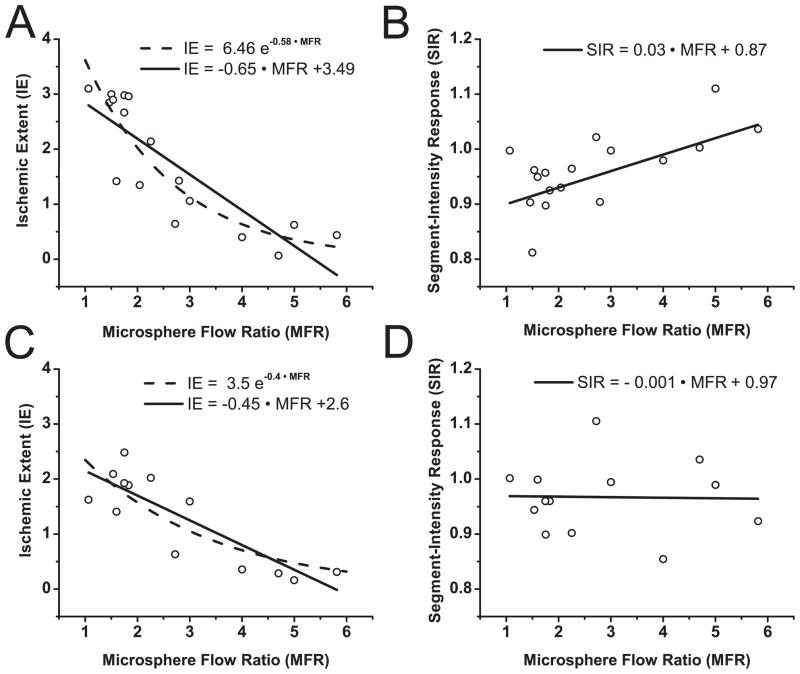
Figure 5.
Ischemic Extent (IE) vs. Microsphere Flow Ratio (MFR) and Segment-Intensity Response (SIR) vs. MFR, derived from BOLD images acquired at end-systole (A and B) and end-diastole (C and D) and microsphere analysis. (A and C) IE vs. MFR; (B and D) SIR vs. MFR. IE values derived from end-systole BOLD images show a stronger correlation to an exponential (R2=0.81) than to a linear function (R2=0.72) of MFR, while SIR shows weaker (linear) correlation with MFR (R2=0.51). IE values derived from end-diastole BOLD images shows an equivalent correlation with exponential and linear functions (R2=0.73) of MFR, while SIR shows no correlation to linear or exponential functions of MFR (R2 ~ 0).

