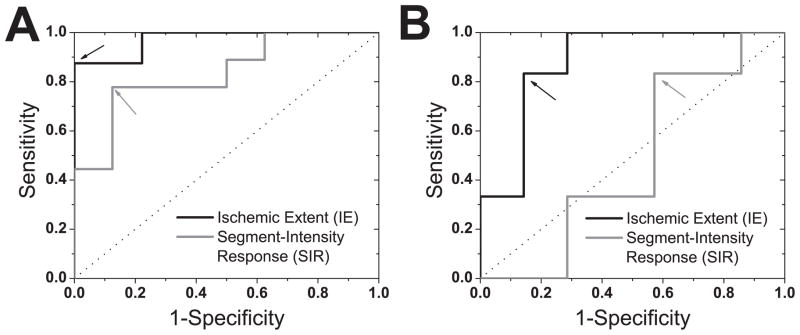
Figure 6.
Receiver-Operating-Characteristic (ROC) Analysis. ROC curves for Ischemic Extent (IE) and Segment-Intensity Response (SIR) metrics, derived from end-systolic (A) and end-diastolic (B) BOLD images, for detecting critical stenosis (MFR ≤2) are shown. For reference, the line of no discrimination is also shown (dotted line). The similarly colored arrows point to the optimal operating cutoff points for each method (listed in Table 3). IE, derived using ARREAS in ES, shows greater sensitivity and specificity compared to SIR measures.

