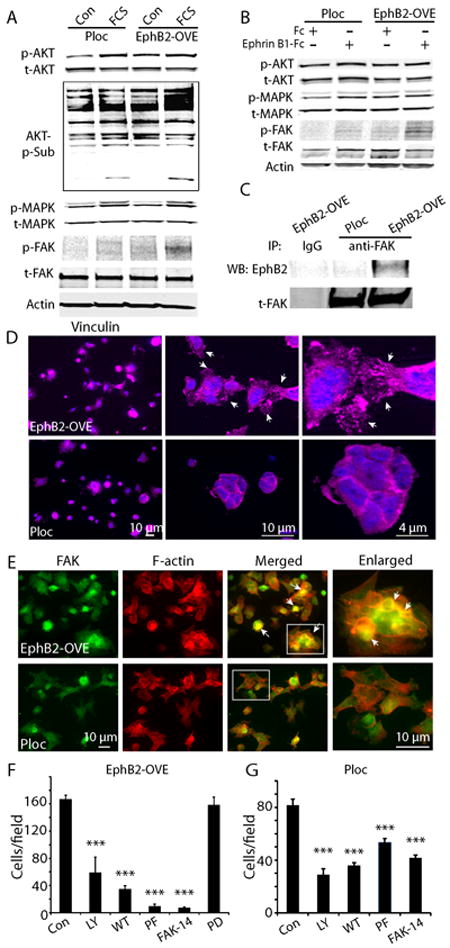
Figure 6. Mechanisms of EphB2-induced cell migration.

(A). Western blot analysis of cell signaling induced by serum (15 min) in Ploc and EphB2-OVE cells. Serum increases AKT and MAPK activation in both Ploc and EphB2-OVE cells. Serum increased phosphorylation of FAK (Y567/577) and AKT substrates in EphB2-OVE cells. (B). Ploc and EphB2-OVE cells were treated with EphB2 ligand ephrin-B1/Fc (1μg/ml) or human Fc (1μg/ml) for 15 min. Western blot analysis of signaling pathways activated ephrin-B1 in Ploc and EphB2-OVE cells showed that FAK (Y567/577) but not AKT or MAPK was significantly activated in EphB2-OVE cells. (C). Whole cell proteins were extracted from Ploc and EphB2-OVE cells and immunoprecipitated with anti-FAK antibody followed by detecting with anti-EphB2 antibody. In EphB2-OVE cells, EphB2 can be co-immunoprecipitaed with FAK. (D). Ploc and EphB2-OVE cells were grown on laminin-coated glass slides for 40 min and stained with anti-vinculin antibody (1:100) and Alex-fluor 647 conjugated secondary antibody. Fluorescent pictures were taken using fluorescent microscope and Axivison program. In EphB2-OVE cultures, strong and punctuated vinculin stainings were found in the spreading edges of cytoplasma, suggesting formation of focal adhesions (arrows). In Ploc cells, vinculin staining were less spread out, suggesting less focal adhesions were formed. Higher magnification microphotographs were shown in the middle and right panels. (E). Ploc and EphB2-OVE cells were grown on laminin-coated glass slides for 2 h and stained with anti-FAK antibody (1:200) and Alex-fluor 647 conjugated phalloidin to detect F-actin. Since Ploc cells were RFP+, FAK was detected with Alex-fluor 488 conjugated secondary antibody in Ploc cells. And FAK in EphB2-OVE cells (GFP+) were detected with cy3-conjugated secondary antibody. Fluorescent pictures were taken using fluorescent microscope and Axivison program and analyzed with Image J. For the simplicity, we used the same color code for both Ploc and EphB2-OVE cells: green for FAK and red for F-actin. In many EphB2-OVE cells, FAK tends to co-localize with F-actin. Arrows in the panel indicated the co-localization of FAK and F-actin (yellow colors). Hatched areas in merged panel were enlarged in the right panel. In Ploc cells, FAK is less co-stained with F-actin. (F). Migration assay in the presence of pathway specific inhibitors. PI3K-AKT pathway inhibitors LY294002 (LY, 10 μmol/L) and wortmannin (WT, 10 μmol/L) partially inhibited EphB2-OVE cell migration towards serum. FAK pathway inhibitors PF573228 (PF, 100 nmol/L) and FAK inhibitor 14 (FAK-14, 10 μmol/L) inhibited more than 90% cell migration in EphB2-OVE cells. The MAPK inhibitor PD98059 (PD, 30 μmol/L) did not have any effect on GBM neurosphere cell migration towards serum. (G). Effect of PI3K-AKT pathway inhibitors LY294002 and wortmannin as well as FAK pathway inhibitor PF573228 and FAK inhibitor 14 on Ploc cell migration towards serum. All the quantifications were performed 18 hours after incubation (***: P<0.001; n=6).
