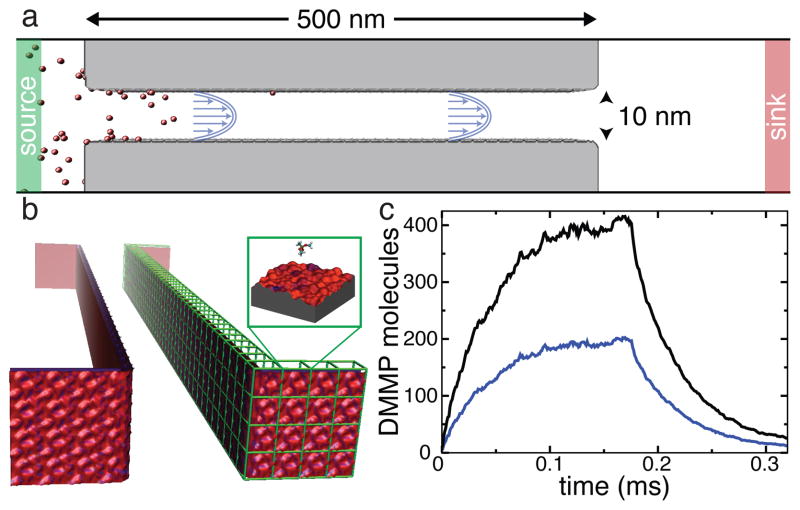
Fig. 6.
Atomic-resolution BD simulation of the rise and fall of DMMP concentration in a sticky 0.5 μm-long silica channel. a Diagram illustrating the setup of a BD simulation. The walls of the channel are shown in gray, the solute particles are shown in red. Green and red regions indicate the source and sink reservoirs where the concentration of solute is maintained constant. The channel is not drawn to scale. b 3D-PMF representation of the surface of the nanochannel, obtained by combining atomically precise 3D-PMF maps of a representative patch of the surface (such as the one shown in Figure 2c). c Sub-millisecond simulation of the rise and fall of solute concentration (see text for details). The total number of DMMP solutes in the nanochannel (black) and number of DMMP adsorbed to the nanochannel’s walls (blue) are plotted versus time.

