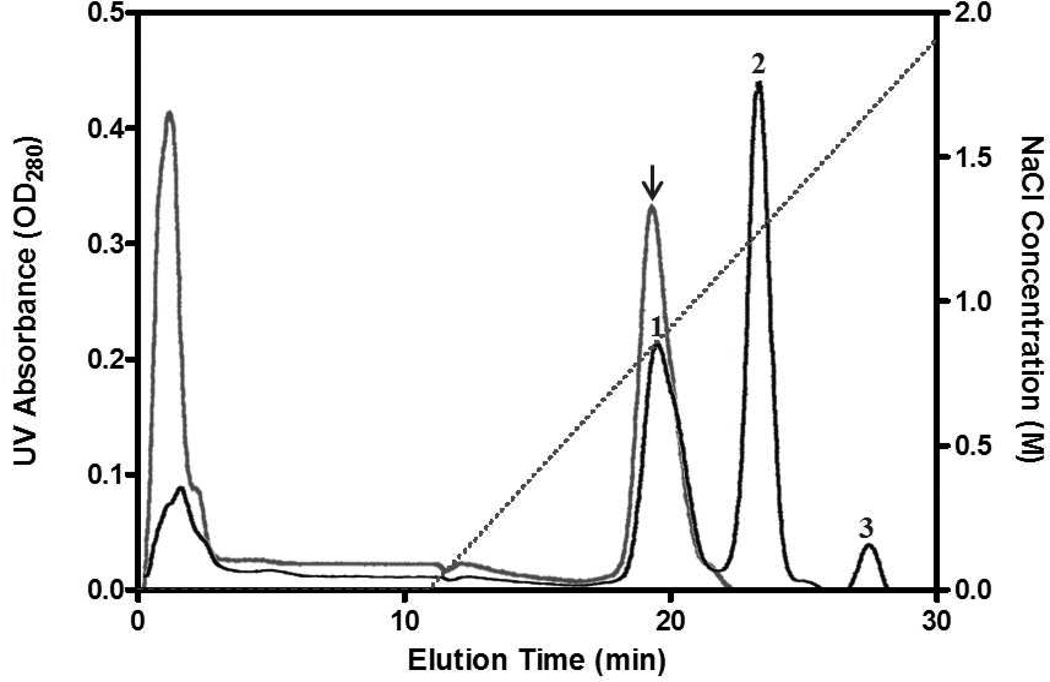
Figure 3.
Chromatograms of Tat-S-S-dmCocE (gray line) and LMWP-S-S-dmCocE (black line) from a heparin column. The NaCl concentration applied in elution was shown in dotted line. Tat-S-S-dmCocE (indicated in arrow) eluted at 0.75 M NaCl whereas LMWP-S-S-dmCocE eluted in three peaks at 0.8 M (Peak #1), 1.2 M (Peak #2), and 1.6 M (Peak #3) of NaCl, respectively. Unreacted dmCocE eluted at the beginning without NaCl gradient.

