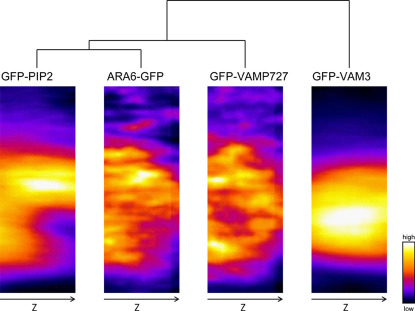
Figure 4. Clustering of the probability maps of YZ sections of GFP-PIP2a, ARA6-GFP, GFP-VAMP727 and GFP-VAM3.
We performed Z-axis registration using the cross-point in the bright field YZ sections (see Supplementary Fig. 6a, b). To facilitate GFP visualization, images are presented in pseudo-color. These maps were obtained from group-averaged images from 100–120 guard cells. All of the image sizes were normalized into a mean size of 73×200 pixels (4.67×12.8 μm). The dendrogram was produced based on raster-scanned intensity profiles (Supplementary Fig. 4) with Euclidean distance and Word's algorithm. Note that the image of ARA6-GFP is more similar to GFP-PIP2a than to GFP-VAMP727, which appears to be located around the vacuolar membrane as shown by GFP-VAM3.

