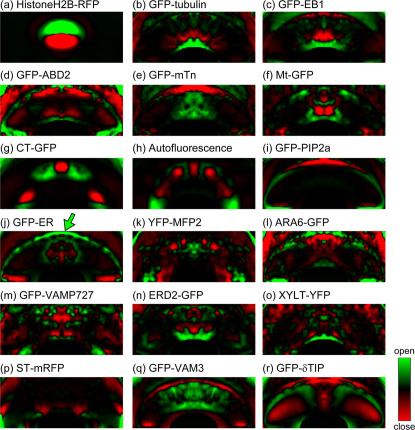
Figure 5. Subtractive images of probability maps of the top 30% and bottom 30% of stomatal apertures.
Green and red colors show the most prominent localizations in opened and closed stomata, respectively. (a) Cell nuclei labeled by HistoneH2B-RFP. (b) Microtubules labeled by GFP-tubulin. (c) Microtubule plus-end labeled by GFP-EB1. (d, e) Actin microfilaments labeled by GFP-ABD2 (d) and GFP-mTn (e). (f) Mitochondria labeled by Mt-GFP. (g, h) Chloroplasts labeled by CT-GFP (g) and autofluorescence (h). (i) Plasma membrane labeled by GFP-PIP2a. (j) Endoplasmic reticulum labeled by GFP-ER. (k) Peroxisomes labeled by YFP-MFP2. (l, m) Endosomes labeled by ARA6-GFP (l) and GFP-VAMP727 (m). (n) cis-Golgi labeled by ERD2-GFP. (o) medial-Golgi labeled by XYLT-YFP. (p) trans-Golgi labeled by ST-mRFP. (q, r) Vacuolar membranes labeled by GFP-VAM3 (q) and GFP-δTIP (r). These subtractive images were obtained from 60-72 guard cell images, and are shown in pseudocolor. These maps were obtained from group-averaged images from 60–72 guard cells. All of the image sizes were normalized into a mean size of 303×128 pixels (19.4×8.2 μm). Note that localization of GFP-ER increased in dorsal side of guard cells of open stomata (arrow).

