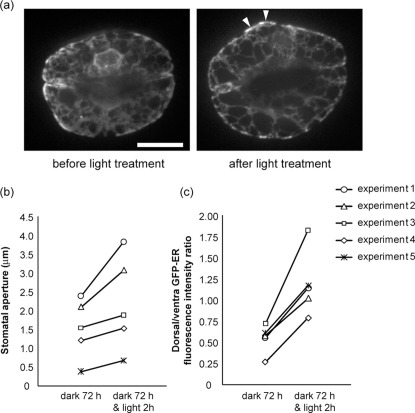
Figure 6. Changes in ER distribution during light-induced stomatal opening.
(a) Time-lapse images of GFP-ER in guard cells. The guard cells were dark-treated for 72 hours (before light treatment) and then irradiated with 200 μmol m−2s−1 white light for 2 hours (after light treatment). Note that GFP-ER became much in the dorsal side after light treatment (arrowheads). Scale bar indicates 10 μm. (b) Changes in stomatal aperture before and after the 2 hour white light treatment. (c) Changes in the dorsal/ventral GFP-fluorescence intensity ratios before and after light treatment. We measured the mean intensities of the line along the dorsal and ventral side (Supplementary Fig. 11). Results from five pairs of guard cells are shown.

