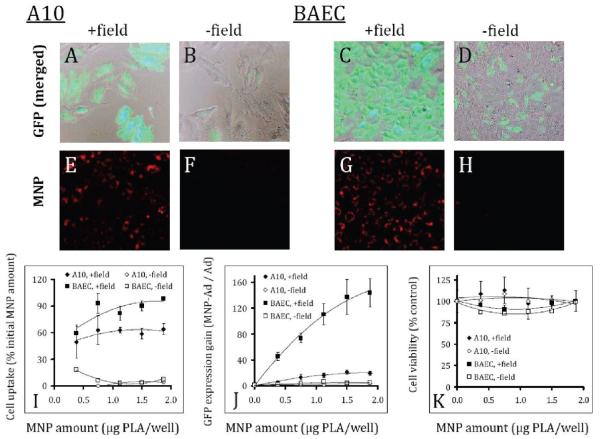
Figure 3.
GFP expression (first row) and cellular localization of complex-forming MNP (second row) in A10 and BAEC observed microscopically 3 days after treatment under magnetic vs nonmagnetic control conditions (columns titled: “+ field” and “− field”, respectively). Merged GFP and bright field images of A10 (A, B) and BAEC (C, D) correspond to the red fluorescent micrographs showing cell-associated MNP (E, F and G, H for A10 and BAEC, respectively).The cells were seeded at a density of 2 × 10³/well on day –1, and treated with MNP–Ad complexes formed using varying amounts of MNP and 7 × 10⁷ Ad/well on day 0. MNP uptake was determined by measuring the MNP-associated fluorescent signal (λem/λex = 540 nm/575 nm) and expressed as a fraction of the initially applied MNP that remained stably associated with the cells (I). Transduction efficiency was determined fluorimetrically (λem/λex = 485 nm/535 nm) 3 days post-treatment and presented as a fold increase in GFP expression vs free Ad for the sake of convenient comparison (J). The cell viability was determined by the Alamar Blue assay 3 days post-treatment using untreated cells as a control (K). The higher cell density of BAEC in comparison with A10 on the merged micrographs (3 days post-treatment) reflects the difference in the respective rates of cell growth under the employed experimental conditions. The original magnification was ×200.

