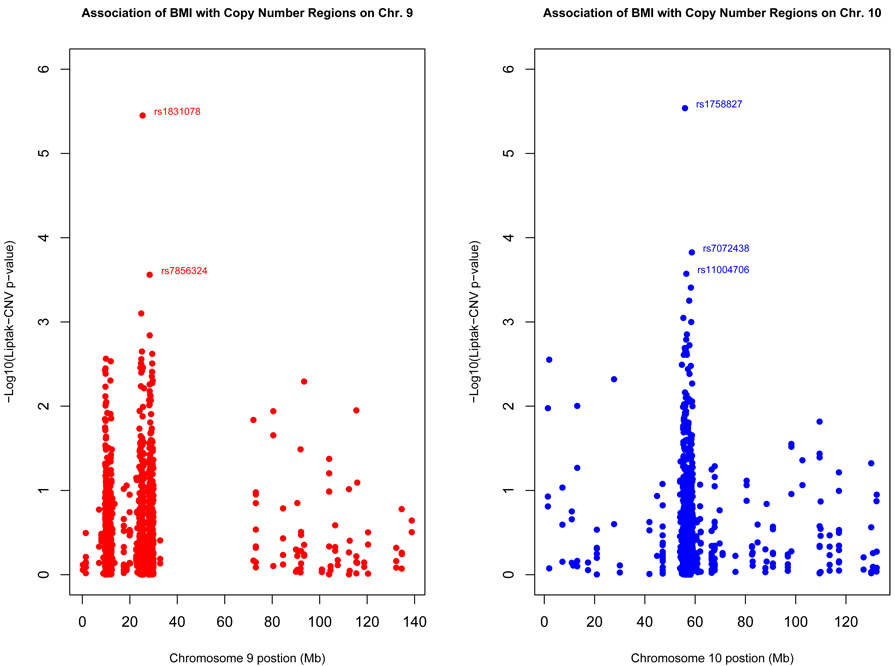
Fig. 1. Association of BMI with Copy Number Regions on Chromosomes 9 and 10.
These figures plot the −Log10 Liptak-CNV p-values against the chromosomal position of SNP in identified copy number regions on chromosomes 9 and 10. There are areas of significant enrichment on both chromosomes, centered around two markers, rs1831078 and rs1758827, which met genome-wide significance criteria.

