
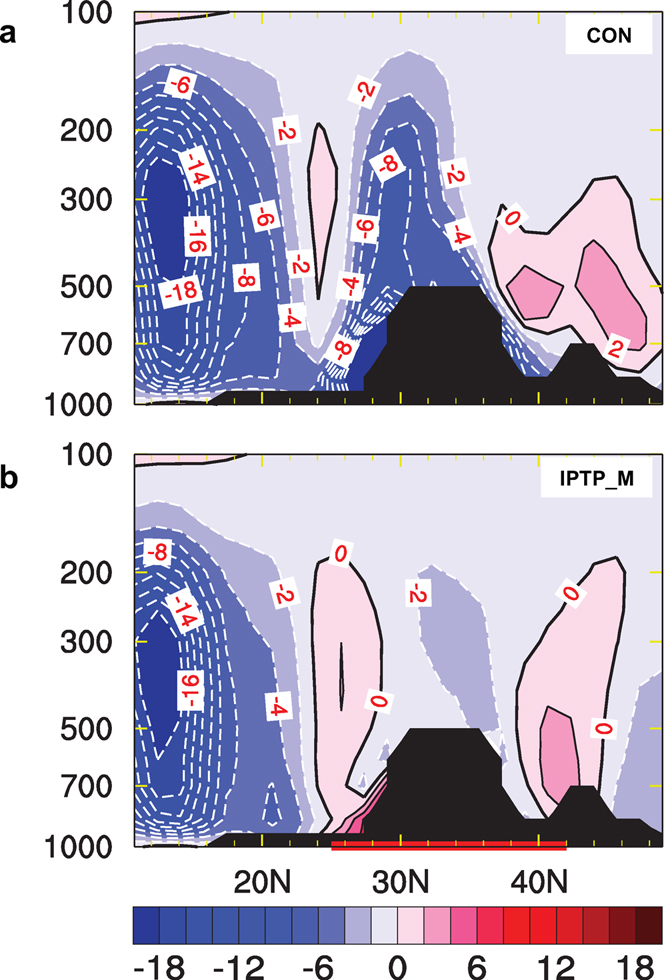
Figure 5. Structure of the South Asian summer monsoon, showing 80°E–90°E longitudinally averaged vertical–meridional cross-sections of pressure vertical velocity (contour interval, 2 × 10⁻² Pa·s–1) for experiments a, CON; and b, IPTP_M.
Official websites use .gov
A
.gov website belongs to an official
government organization in the United States.
Secure .gov websites use HTTPS
A lock (
) or https:// means you've safely
connected to the .gov website. Share sensitive
information only on official, secure websites.