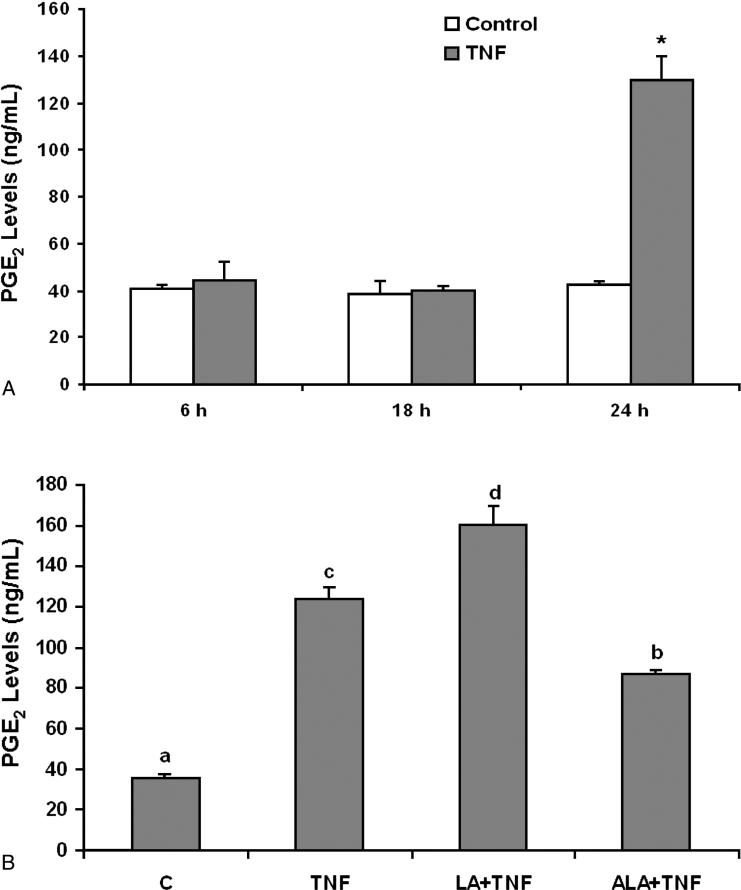
Figure 5.
Effect of linoleic acid (LA) and α-linolenic acid (ALA) on TNF-α-stimulated release of PGE2 from endothelial cells. (A) Cells were exposed to 0.5 ng/mL TNF-α for 6, 18 and 24 hours. Supernatants of cell cultures were collected and PGE2 levels were measured by enzyme immunoassay (EIA). Bars represent means ± SEM from three independent experiments. * represents significant difference compared with the control treatment. (B) Cells were pretreated with 20 μmol/L of LA or ALA for 24 hours and then exposed to 0.5 ng/mL TNF-α for additional 24 hours. Supernatants of cell cultures were collected and PGE2 levels were measured by EIA. Values are means ± SEM (n=3). Different letters represent significant difference among treatment groups.

