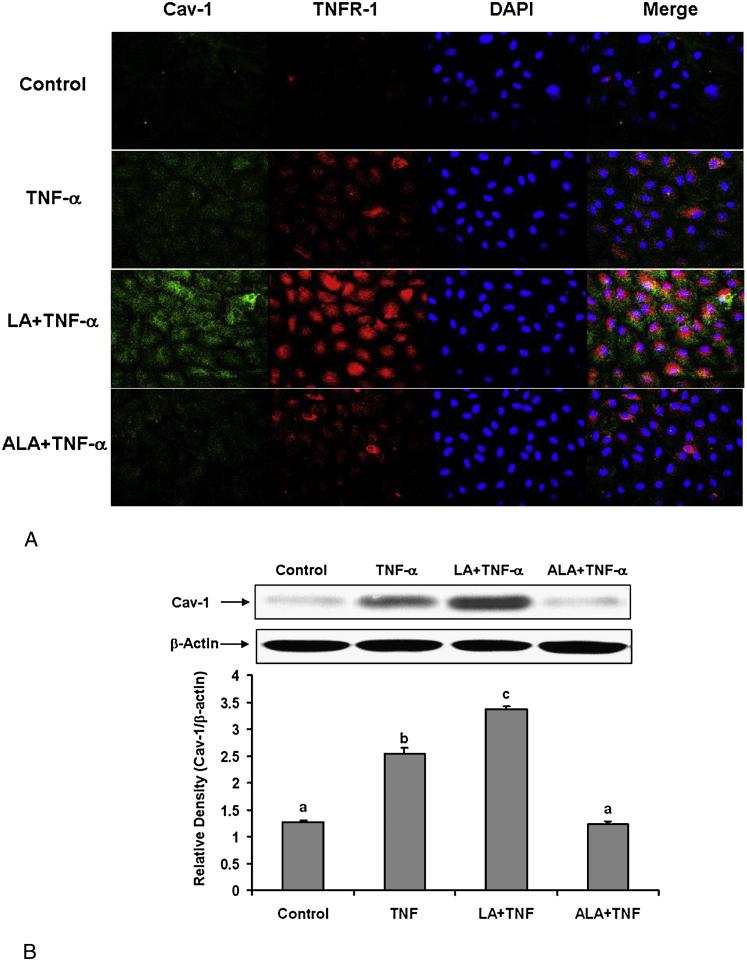
Figure 6.
Effect of linoleic acid (LA) and α-linolenic acid (ALA) on TNF-α-induced up-regulation of caveolin-1 and colocalization of TNFR-1 and caveolin-1. Cells were treated with 0.5 ng/mL TNF-α alone for 4 hours, or pretreated with 20 μmol/L LA or ALA for 24 hours followed by exposure to TNF-α for 4 hours. (A) Immunofluorescence staining for caveolin-1 (FITC green fluorescence), TNF Receptor-1 (TNFR-1) (Texas red fluorescence), and nuclei (DAPI blue fluorescence). Regions of co-localization of caveolin-1 and TNFR-1 are depicted in yellow in the merged images. Experiments were repeated three times and the epifluorescence micrographs shown are representative fields of one of the experiments (original magnification, × 400). (B) Caveolin-1 protein levels were detected by Western blotting and normalized according to β-actin expression. Experiments were repeated three times, and the blots shown are a representative of one of the experiments. The bar graph shows the corresponding densitometric analysis of the blots. Values are means ± SEM. Different letters represent significant differences among treatment groups.

