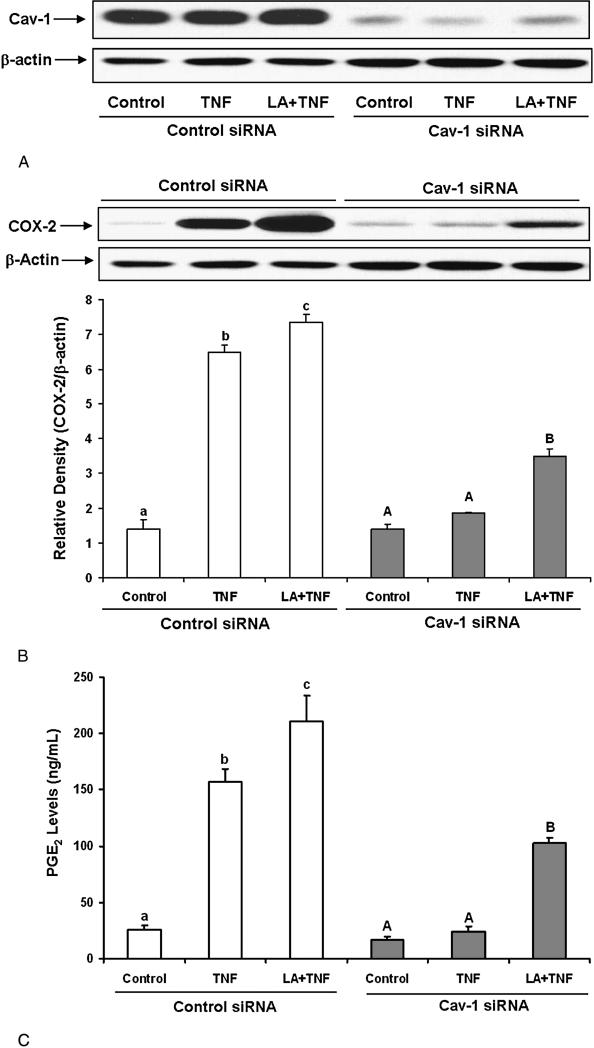
Figure 7.
Effect of caveolin-1 silencing on TNF–α- and linoleic acid (LA)-induced COX-2 expression and PGE2 synthesis. Cells were transfected with siRNA for caveolin-1 (Cav-1 siRNA) or with scrambled control siRNA. Then, cells were treated with 0.5 ng/mL TNF-α alone for 24 hours, or pretreated with 20 μmol/L LA for 24 hours followed by exposure to TNF-α for additional 24 hours. Caveolin-1 protein levels were measured by Western blotting and normalized according to β-actin expression (Figure 7A). COX-2 protein levels were measured by Western blotting under the same experimental conditions as in Figure 7A (Figure 7B). Supernatants of cell cultures were collected and PGE2 levels were measured by EIA (Figure 7C). Experiments were repeated three times and the blots shown are a representative of one of the experiments. Values are means ± SEM. Different letters represent significant difference among treatment groups.

