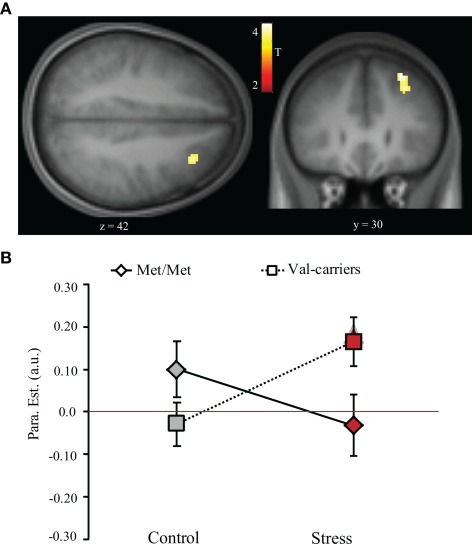
Figure 3.
Stress-by-COMT genotype interaction effect on WM-related activity in the dorsolateral PFC. (A) Transversal (left panel) and coronal (right panel) view of activation in the right dorsolateral PFC showing significant stress-by-COMT genotype interaction effect. Statistical parametric maps are superimposed onto spatially normalized and averaged (n = 39) high-resolution T1-weighted images (thresholded at p < 0.001 uncorrected for visualization purposes). (B) Bar graphs representing parameter estimates of WM-related activation under control and stress conditions in Met-homozygotes (Met/Met) and Val-carriers. The data for these bar graphs were only extracted to illustrate the interaction effect. Note: Control, control condition; PFC, prefrontal cortex; Stress, stress condition; error bars in the graph represent standard error of mean; T, color coded t values obtained from the whole brain analysis.

