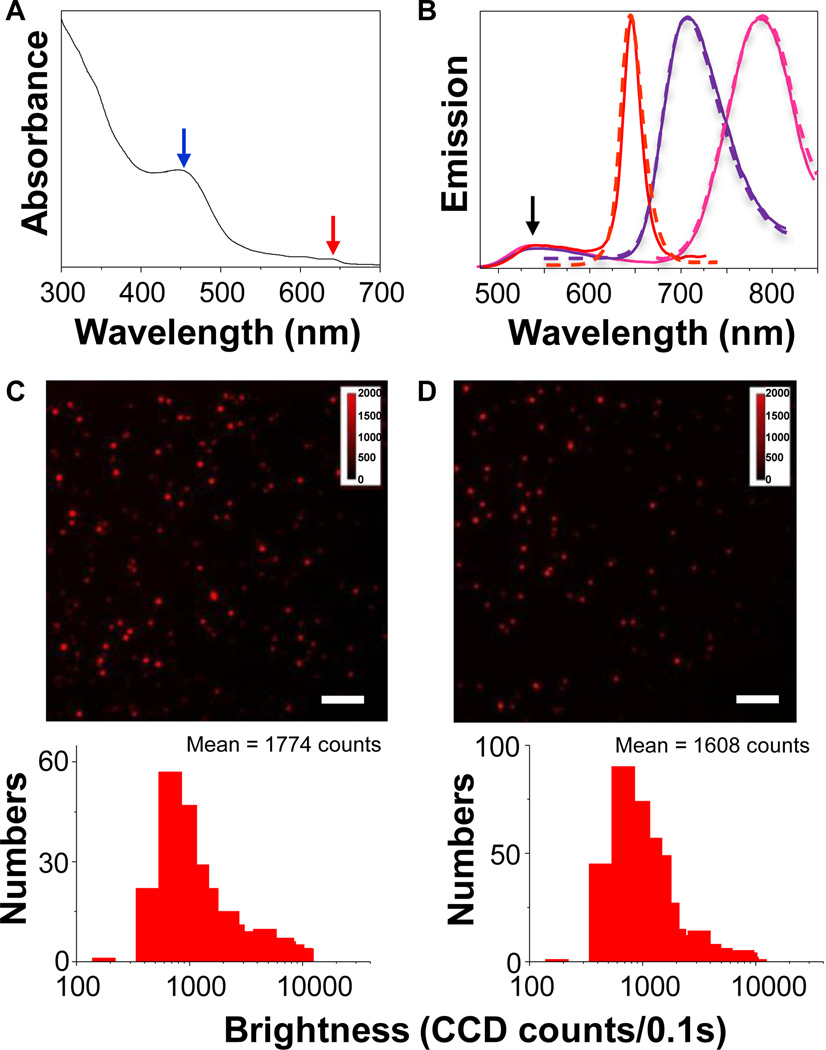
Figure 2.
Characterization of Pdot-Qdot nanoparticles (NPs). (A) UV-visible spectrum of Pdot-Qdot NPs in water. (B) Emission spectra of QD655 (dashed red line), QD705 (dashed purple line), and QD800 (dashed pink line) in decane. Emission spectra of their corresponding Pdot-Qdot forms after nanoprecipitation were shown in solid lines. (C) Single-particle fluorescence images of PFBT-DBT Pdots (PFBT blended with 4,7-di-2-thienyl-2,1,3-benzothiadiazole) (upper graph) and the corresponding histograms showing the intensity distributions (bottom graph). (D) Single-particle fluorescence images of PFBT-QD655 Pdots (upper graph) and the corresponding histograms showing the intensity distributions (bottom graph). The scale bars are 4 µm. Each histogram is based on the measurements of at least 700 individual particles.

