Figure 3.
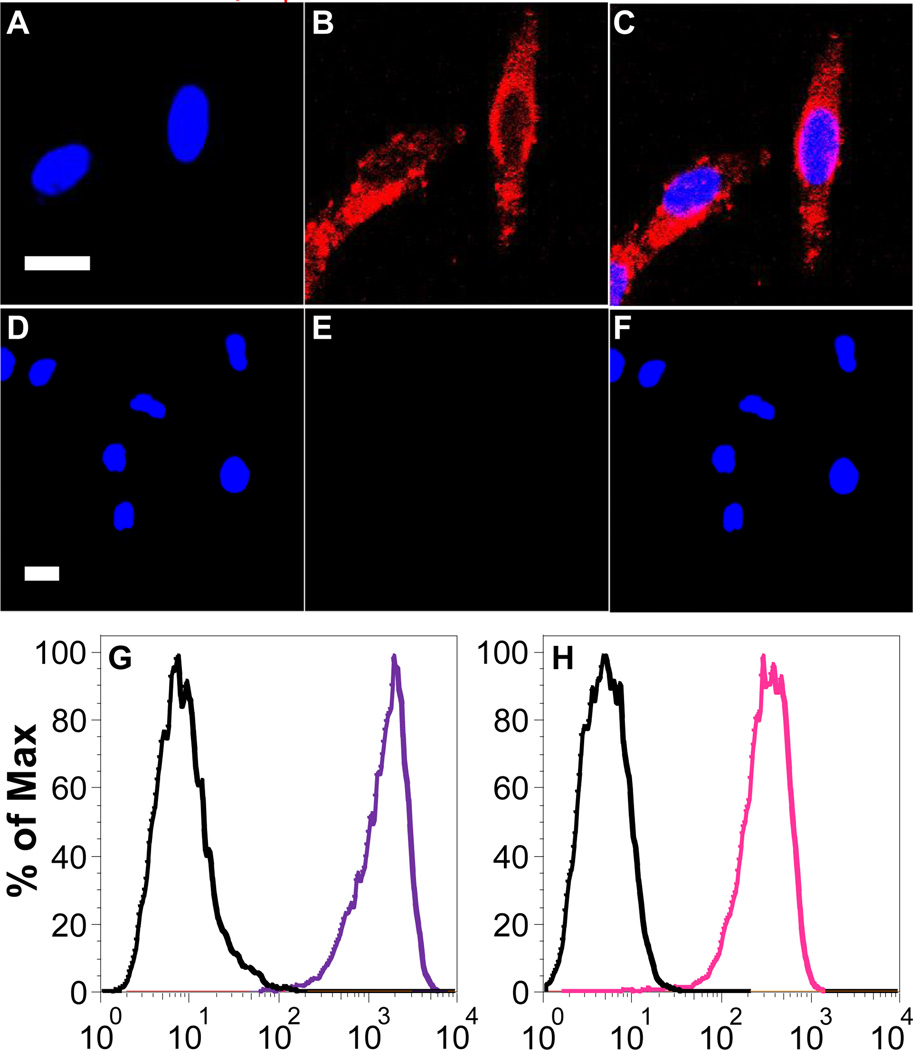
Two-color confocal microscopy images of microtubules in HeLa cells labeled with Pdot-QD705-streptavidin. The blue fluorescence was from nuclear counterstain Hoechst 34580 and the red fluorescence was from Pdot-QD705-streptavidin. (A) Image of nucleus. (B) Image of microtubules. (C) The overlay of panels (A) and (B). (D–F) Images of negative control samples where cells were incubated with Pdot-QD705-streptavidin but in the absence of biotinylated primary antibody. The scale bars are 20 µm. (G–H) Flow cytometry detection of Pdot-Qdot labeled MCF-7 cells. The purple and pink lines show the fluorescence intensity distributions of Pdot-QD705-streptavidin and Pdot-QD800-streptavidin labeled cells, respectively. The black lines represent the results of negative control samples where no primary Biotin anti-human CD326 EpCAM antibody was present.

