Figure 1.
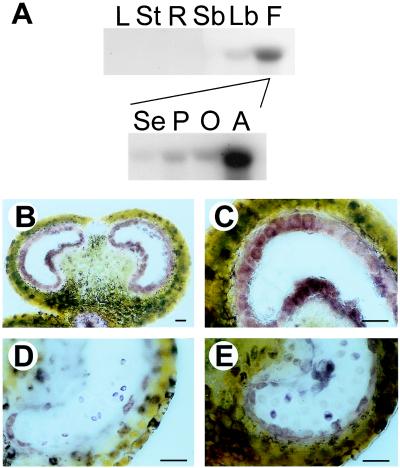
Tissue-specific expression pattern of Nin88. (A) RNA blot analysis of Nin88 expression in different tobacco tissues: L, leaves; St, stem; R, roots; Sb, small buds; Lb, large buds; F, flowers; Se, sepals; P, petals; O, ovary; A, anther. (B– E) Immunolocalization of Nin88 with cross-sections of anthers at different developmental stages. (B) Tapetum surrounding the pollen mother cells. (Bar = 50 μm.) (C) Tapetum surrounding the pollen mother cells. (Bar = 50 μm.) (D) Microspores in tetrad stage. (Bar = 50 μm.) (E) Tapetum shrunken, pollen grains separated. (Bar = 50 μm.)

