
Fig 1.
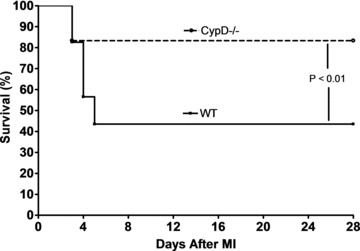
Kaplan–Meier survival curve analysis for WT (n= 23) and CypD–/– (n= 12) mice after MI. CypD–/– mice experienced significantly better survival after MI when compared to WT mice. Note that all deaths occur between 3 and 5 days after MI. Sham-operated WT and CypD–/– mice have 100% survival rate (not shown in figure).