
Fig 2.
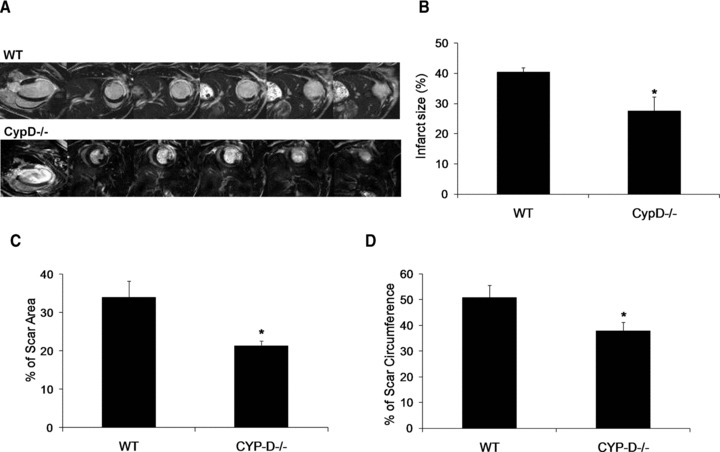
(A) Representative two-chamber and short-axis MRI late gadolinium enhancement images of the WT and CypD–/– mice at 2 days after MI. (B) Graph showing a smaller myocardial infarct size expressed as a percentage of LV volume at 2 days after MI in CypD–/– mice (n= 6) when compared to WT (n= 5). Infarct size was expressed as (C) percentage of scar area and (D) percentage of scar circumference in WT (n= 10) and CypD–/– (n= 10) mice 28 days after MI. *P < 0.05 versus WT.