
Figure 2.
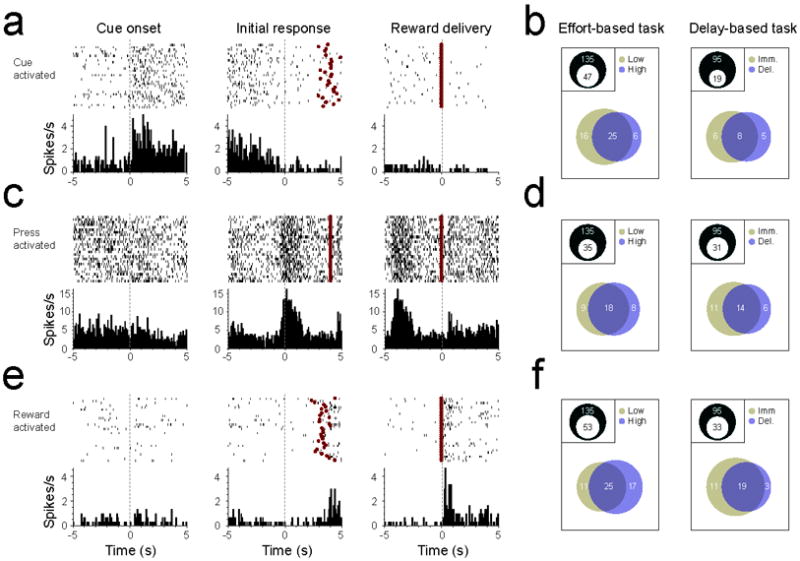
NAc neurons are activated during different components of the task. (a) Peri-event histogram (PEH) and raster plots of a representative cue-activated NAc neuron. Data shown are from high cost trials in the effort-based task, and are aligned to cue onset (left panel), the initial lever press response (middle panel), and reward delivery (right panel). Red circles in raster indicate timing of reward delivery. (b) Venn diagrams illustrating proportion of neurons that exhibited excitations following cue onset for the effort- and delay-based tasks. Insets show proportion of total cells that were activated by cues. Lower diagrams show number of cells that responded to the high value cue (gold), low value cue (blue), or both cues (overlap). (c) PEH and raster plots of a representative press-activated NAc neuron. Data shown are from delayed reward trials in the delay-based task. (d) Venn diagrams illustrating proportion of neurons that exhibited excitations preceding the lever press for the effort- and delay-based tasks. (e) PEH and raster plots of a representative reward-activated NAc neuron. Data shown are from high cost trials in the effort-based task. (f) Venn diagrams illustrating proportion of neurons that exhibited excitations following reward delivery for the effort- and delay-based tasks.