
Figure 3.
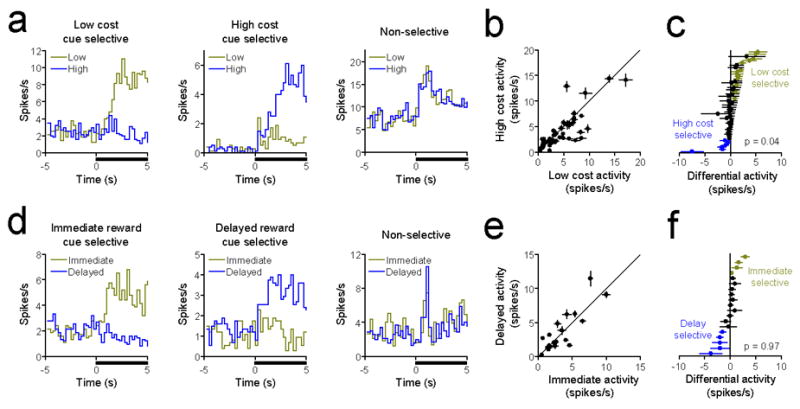
Cue-activated neurons exhibit selective responses that encode future reward cost but not reward delay. (a) PEHs of representative low cost selective (left panel), high cost selective (middle panel), and non-selective (right panel) cue-activated NAc neurons during the effort task. Data are aligned to cue onset (black bar). (b) Mean activity (±SEM) of cue-activated NAc neurons on low and high cost trials. Diagonal line represents purely non-selective activity. (c) Differential activity of all cue-activated NAc neurons in the effort task (low cost minus high cost). Each circle represents a single neuron, with low cost selective neurons shown in gold, non-selective neurons in black, and high cost selective neurons in blue. As a population, these neurons were significantly biased towards the low cost option (p = 0.04). (d) PEHs of representative immediate reward selective (left panel), delayed reward selective (middle panel), and non-selective (right panel) cue-activated NAc neurons during the delay task. (e) Mean activity (±SEM) of cue-activated NAc neurons on immediate and delayed reward trials. Diagonal line represents purely non-selective activity. (f) Differential activity of all cue-activated NAc neurons in the delay task (immediate minus delayed reward). Conventions follow from panel c. As a population, these neurons were not significantly selective for either option (p = 0.97).