
Figure 6.
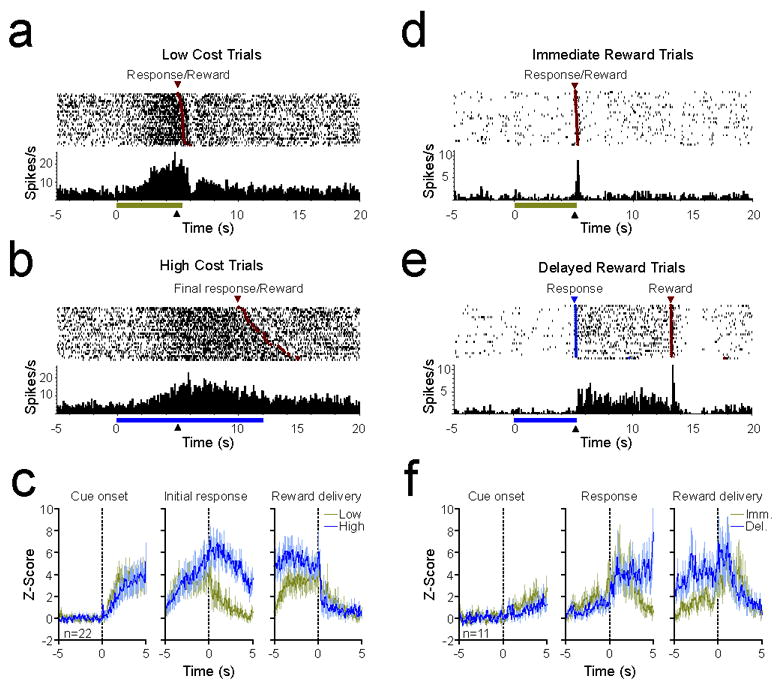
A subset of NAc neurons is activated throughout reward seeking or delay period. (a-b) PEH and raster plots from a representative reward-seeking activated NAc neuron on low and high cost trials. For both, data are aligned to cue onset, and the black triangle denotes lever extension (at 5s). Trials in raster plots are sorted based on the latency between lever extension and reward delivery (red circles). (c) Mean (± SEM) Z-score of 22 neurons that were excited throughout execution of response requirements on high cost trials. Data are aligned to cue onset (left panel), the initial response (center panel), and reward delivery (right panel). On high cost trials, activity was maintained until reward delivery. (d-e) PEH and raster plots from a single representative delay-activated NAc neuron on immediate and delayed reward trials. Blue circles in raster indicate lever press responses. Other conventions follow from panel a. (f) Mean (± SEM) Z-score of 11 neurons that were activated during the delay period on delayed reward trials. Data are aligned to cue onset (left panel), the lever press response (center panel), and reward delivery (right panel). On delayed reward trials, activity was maintained until reward delivery.