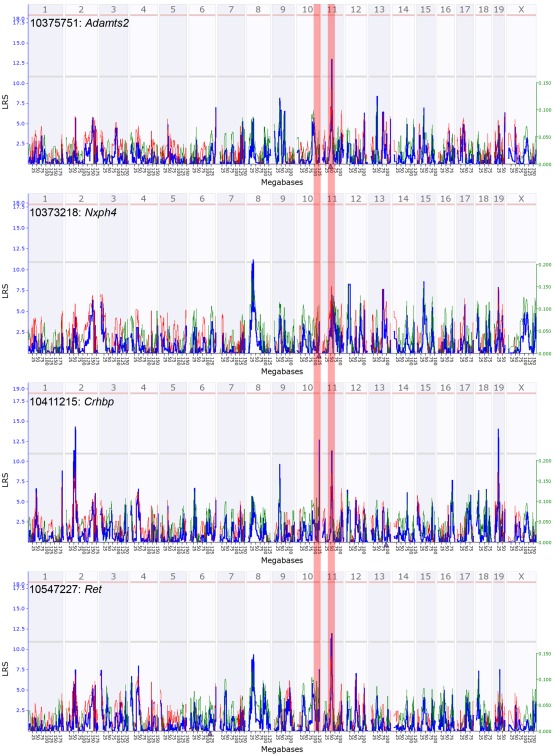
Figure A4.
Quantitative trait loci maps of M9 members in males. These are genome-wide QTL maps for M9 members – Adamts2, Nxph4, Crhbp, and Ret. The Adamts2 transcript has a suggestive cis-QTL on mid chromosome 11 (highlighted zone). Crhbp and Ret have suggestive trans-QTL on mid chromosome 11. Nxph4, located on chromosome 10, does not map as a cis-QTL in males (highlighted zone). x-axis represents chromosomes 1 to x and the y-axis shows the LRS scores. Horizontal lines indicate the genome-wide suggestive and significant thresholds.

