
FIG 4.
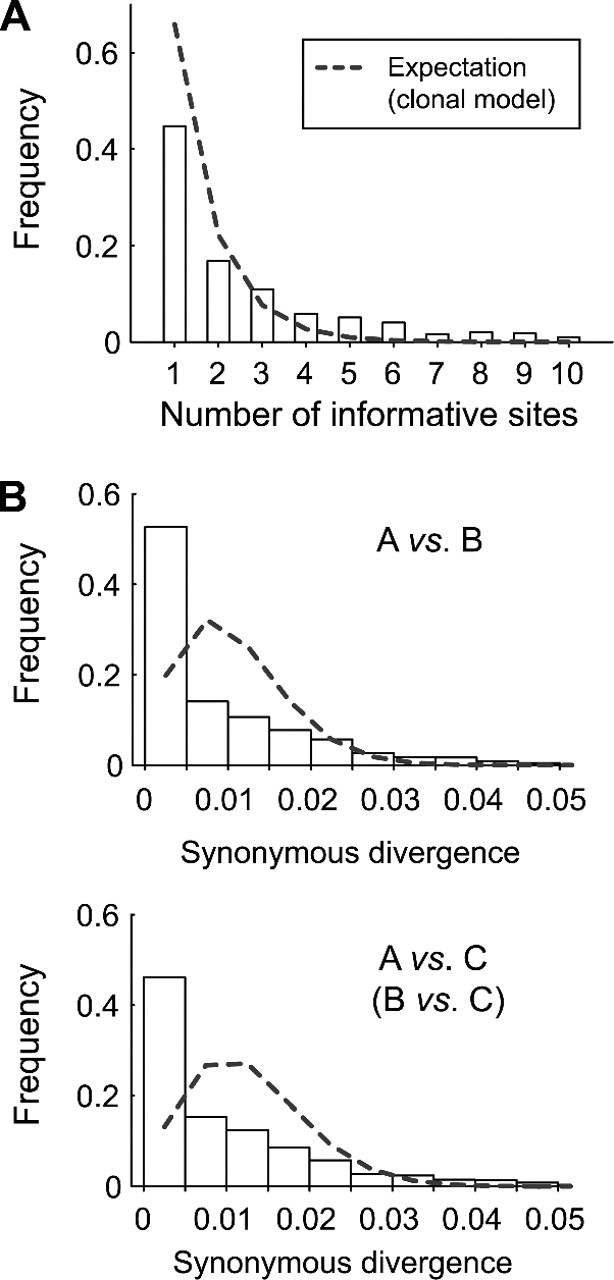
Testing a strict clonal model. (A) The number of informative sites with the same configuration in a cluster. (B) The synonymous divergences between A, B, and C. The observed distribution is shown in the bars with the expectations under the strict clonal model (gray broken line). The result for B versus C is not shown because it is almost identical to that of A versus C.