
FIG 2.
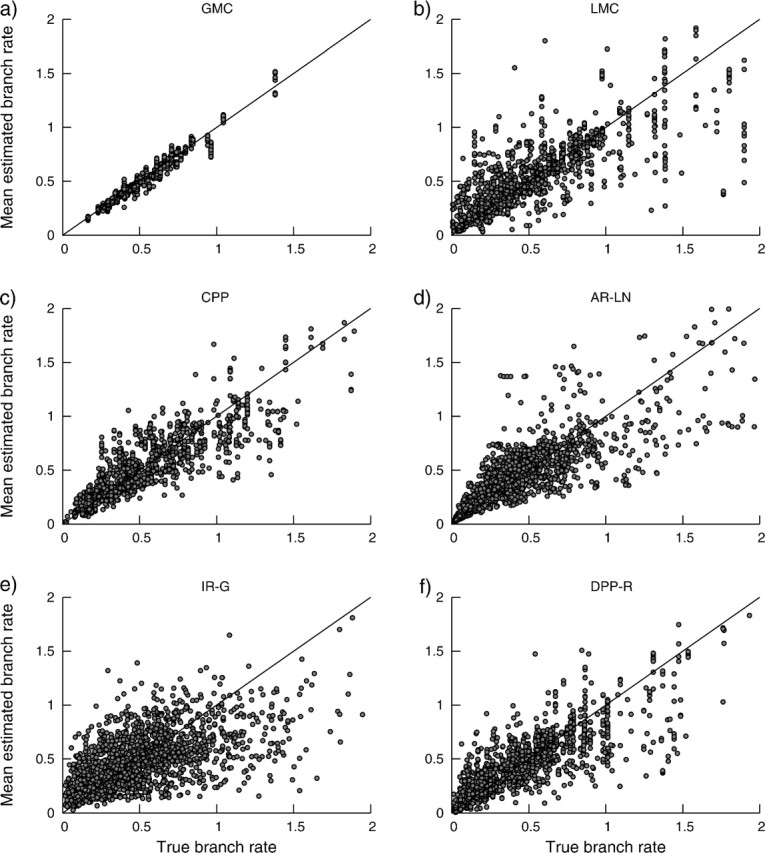
The posterior mean lineage-specific rates estimated under the DPP model compared with the true branch rates for data sets with substitution rates generated under different models of among-lineage rate variation: (a) the GMC, (b) LMCs, (c) the CPP, (d) AR-LN, (e) IR-G, and (f) uncorrelated rates generated under the Dirichlet process. Each point represents a single mean branch rate estimate across all simulation replicates. The solid line indicates the line of equality.