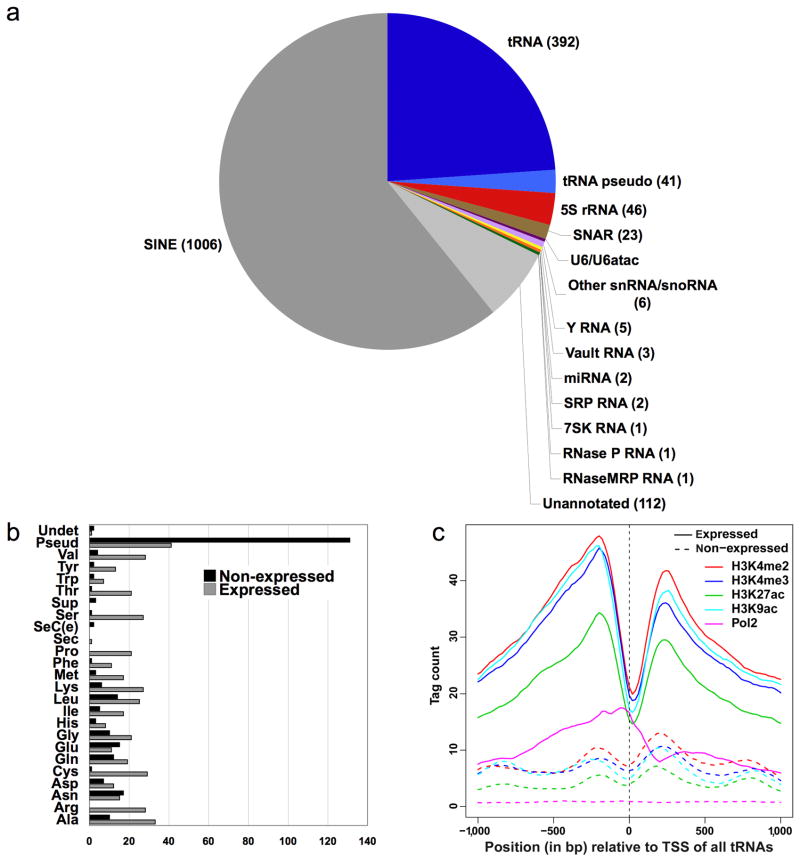
Figure 2.
Properties of Pol III targets. (a) Pie chart depicting the categories of Pol III-occupied loci. (b) Occupancy of tRNA genes by isotype. (c) Positions of histone modifications and Pol II occupancy relative to expressed (i.e., Pol III-occupied, solid lines) or non-expressed (dashed lines) tRNA genes.

