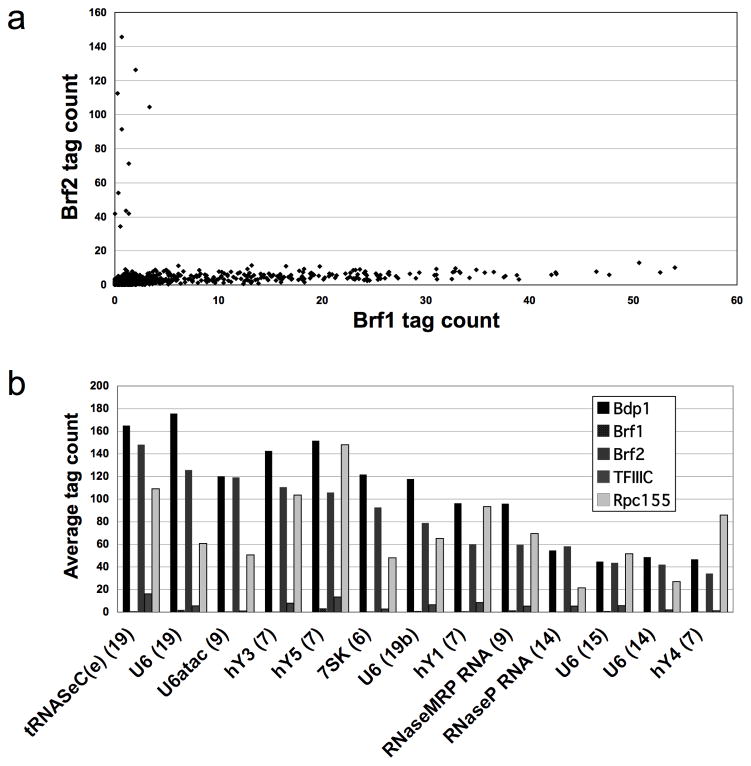
Figure 3.
Distinctions between TFIIIB isoforms. (a) Pairwise comparison of Brf1 and Brf2 occupancy at Rpc155 peaks. The average number of sequence reads for Brf1 and Brf2 are compared for the 300bp window centered at each Rpc155 summit. (b) Tag counts for all five proteins at Brf2 targets. Tag counts are shown for each protein within a 300bp window centered at the summit of every indicated Brf2 peak (the chromosome number of each locus is indicated in parentheses). We show only those peaks with above-background levels of Rpc155. Rpc155 tag counts were divided by 25 to allow use of a single scale for viewing all proteins.

