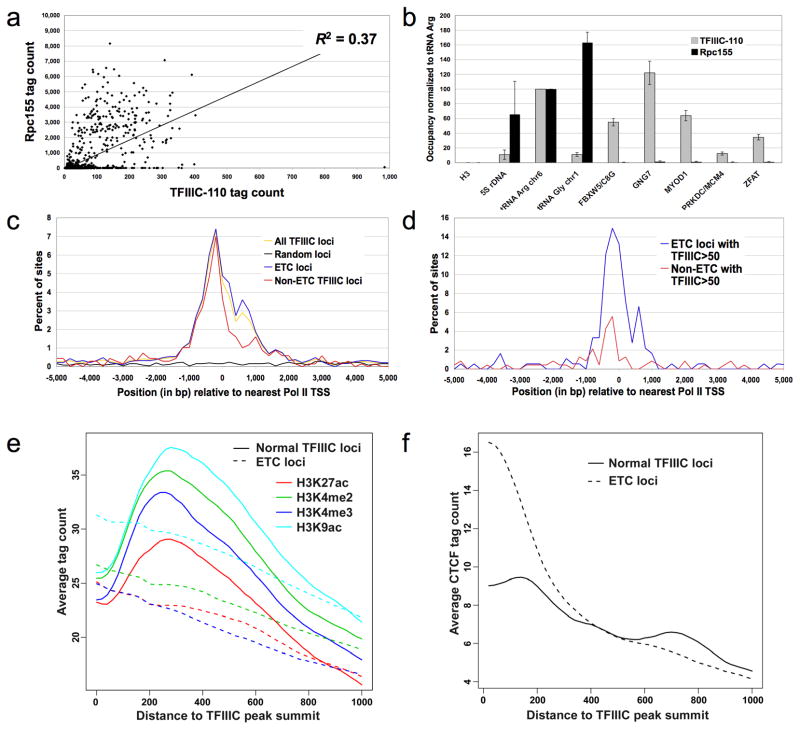
Figure 4.
Relationship of TFIIIC occupancy to Pol III occupancy and identification of ETC loci. (a) Correlation of Rpc155 and TFIIIC-110 occupancy at TFIIIC-110 peaks. Comparison of the number of Rpc155 and TFIIIC-110 sequence reads within the 300 bp window centered on each TFIIIC-110 peak summit. (b) Pol III and TFIIIC-100 association (± s.d.) at typical (left) and ETC (right) loci by quantitative PCR in real-time. (c) ETC loci are near the TSS of Pol II genes. Frequency distribution of TFIIIC-110 peak summits with respect to the nearest Pol II TSS. (d) Frequency distribution of ETC and non-ETC TFIIIC-110 peaks with the highest TFIIIC levels (average tag counts >50 in the 300bp-window around the peak summit) with respect to Pol II TSS. (e) Positions of histone modifications relative to TFIIIC-110 peak summits at non-ETC (solid lines) or ETC (dashed lines). (f) CTCF tag count as a function of distance from TFIIIC-110 peak summits for non-ETC (solid lines) or ETC (dashed lines) loci.

