
Figure 2.
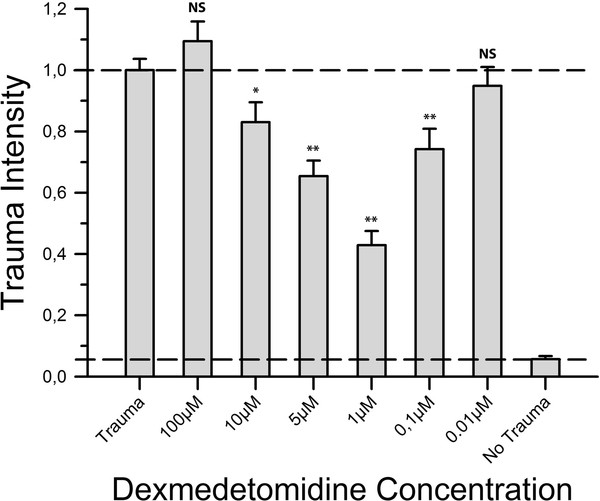
Neuroprotective effect of dexmedetomidine. After trauma, slices were exposed to varying concentrations of dexmedetomidine. Following 72 h of incubation fluorescence images were taken and analysed. For each group an average of 52 slices with a minimum of 39 slices was used. Trauma intensities of the different groups are shown in relation to trauma intensity in the positive control group (n = 185). Trauma intensity was significantly lower in the groups 10 μM, 5 μM, 1 μM and 0.1 μM (*p ≤ 0.05, **p ≤ 0.001) when compared to the positive control group. In contrast, the groups 100 μM and 0.01 μM showed no statistical difference compared to the positive control group (p = 0.213 and p = 0.485, respectively).