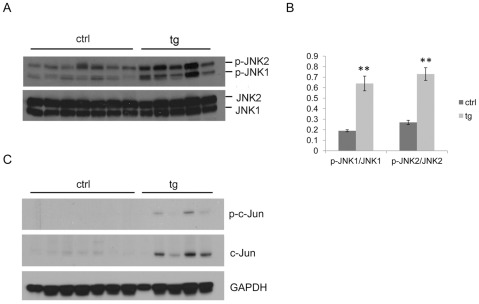
Figure 1. Activation of JNK in the liver of 2-year old HBV transgenic mice.
(A) Western blot analysis of phosphorylated and total JNK in control (n = 7) and HBV transgenic (n = 5) mice. (B) Quantification of the activation of JNK1 and JNK2 (mean ± SEM) in control and HBV transgenic mice described in (A). Significant differences between control and HBV transgenic mice are indicated by two (P<0.01) asterisks. (C) Western blot analysis of phosphorylated and total c-Jun in the same control and HBV transgenic mice as described in (A).

