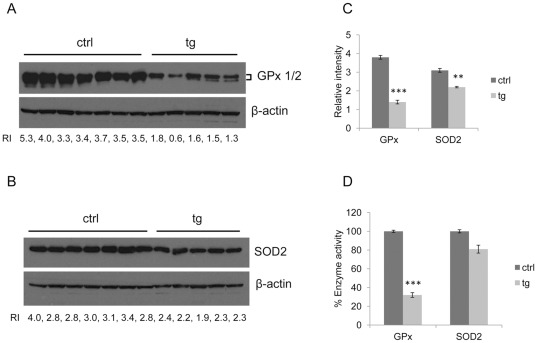
Figure 2. Down-regulation of antioxidant enzymes GPx and SOD2 in HBV transgenic mice.
(A) Western blot analysis of GPx in the liver of the same control and HBV transgenic mice as described in Figure 1. Relative intensity (RI) refers to the intensity of GPx normalized to that of actin, which was used as the loading control. (B) Western blot analysis of SOD2 in the liver of the same control and HBV transgenic mice as described in Figure 1. RI refers to the intensity of SOD2 relative to that of actin. (C) Mean values of the RIs of GPx (mean ± SEM) and SOD2 (mean ± SEM) in control and HBV transgenic mice described in (A) and (B). Significant differences between control and HBV transgenic mice are indicated by three (P<0.0001) and two (P<0.01) asterisks. (D) Relative enzymatic activities of GPx and SOD2 in the same control and HBV transgenic mice as described in (A) and (B). The enzyme activities of GPx and SOD2 in the liver of control and HBV transgenic mice were measured and normalized to the protein concentrations. The enzyme activities of the control mice were arbitrarily defined as 100% (mean ± SEM). Significant differences between control and HBV transgenic mice are indicated by three asterisks (P<0.0001).

