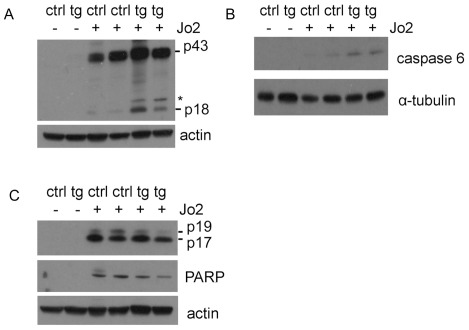
Figure 5. Fas-mediated activation of caspases 8, 6 and 3 in HBV transgenic mice.
(A) Western blot analysis of cleaved caspase 8. The cleaved 43 kDa and 18 kDa caspase 8 protein bands are highlighted, *non specific protein band. RI refers to the intensity of cleaved p43 and p18 relative to that of actin. (B) Western blot analysis of cleaved caspase 6. RI refers to the intensity of caspase 6 relative to that of α-tubulin. (C) Western blot analysis of cleaved caspase 3 and PARP. The cleaved 19 kDa and 17 kDa caspase 3 protein bands are highlighted. RI refers to the intensity of cleaved p19, p17 and PARP relative to that of actin.

