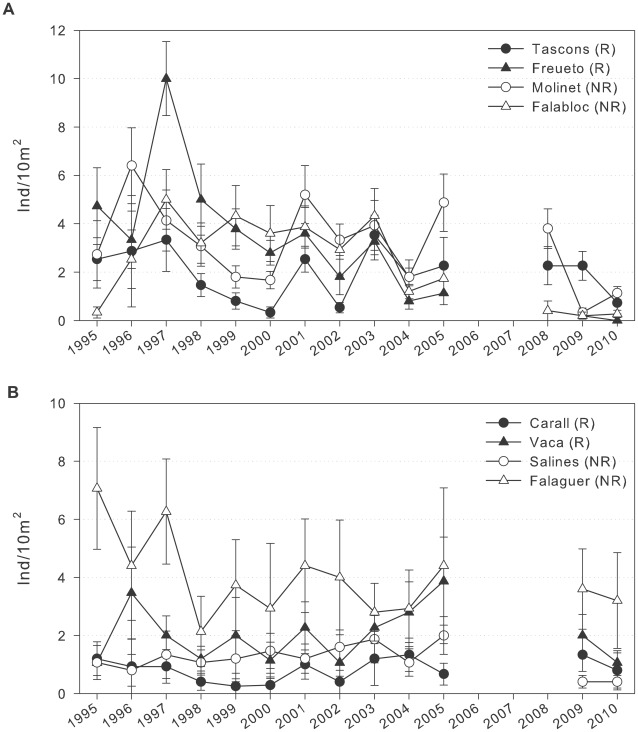
Figure 4. Arbacia lixula density over time.
The number of Arbacia lixula (>1 cm diameter) per 10 m2 (mean ± SE) over time at each site in the MIMR on a) boulder substrates and (b) vertical walls. Solid symbols represent sites within the reserve (R); open symbols represent sites in the nearby unprotected area (NR). Note the different scales of both types of habitat.

