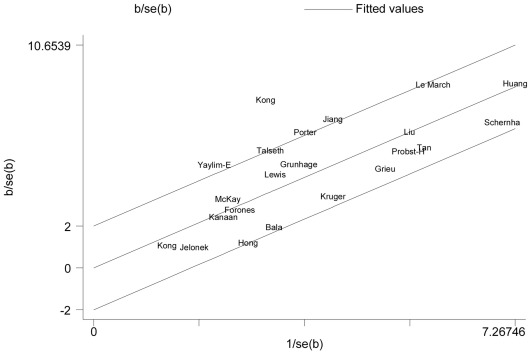
Figure 2. Galbraith plot [12] analysis of the amount of heterogeneity from all the included studies (AA vs. GG).
The y-axis shows the ratio of the log OR to its standard error (SE), and the x-axis shows the reciprocal of the SE. Each study is represented by the name of the first author. A regression line runs centrally through the name. At a 2 standard deviation distance parallel to the regression line, the 2 lines create an interval. Studies lacking in heterogeneity would lie within the 95% confidence interval (positioned 2 units above and below the central regression line).

