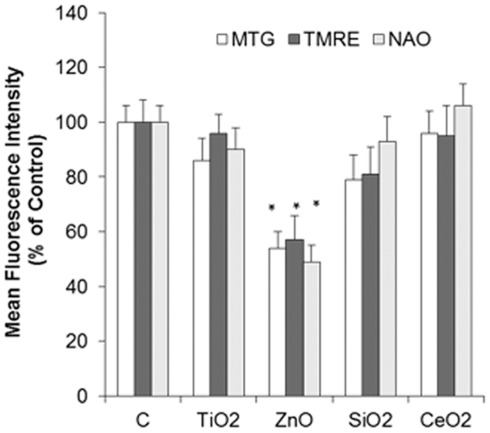
Figure 4. Effect of n-TiO2, n-SiO2, n-ZnO, n-CeO2 on mitochondria of mussel hemocytes.
Hemocytes were exposed to different n-oxides (10 µg/ml) for 45 min and subsequently loaded with the fluorescent dyes Mito Tracker MT (for mitochondrial mass/number), with TMRE (for membrane potential Δψm) and with NAO for cardiolipin content and fluorescence intensities were evaluated by flow cytometry as described in methods. Data are reported as Mean Fluorescence Intensities (percent) with respect to controls. Data, representing the mean±SD of three experiments, were analysed by ANOVA followed by Tukey’s post hoc test. * = P≤0.05, all treatments vs controls.

