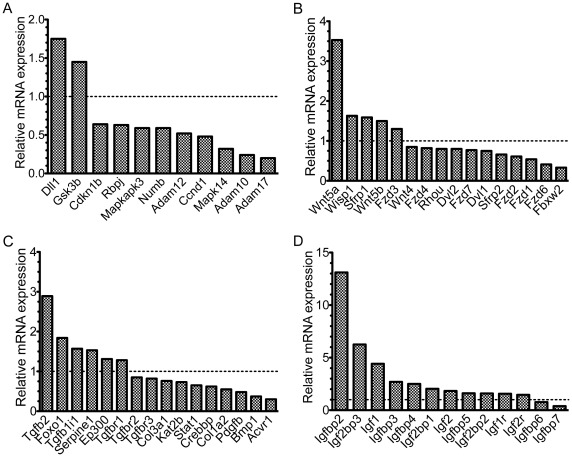
Figure 1. mRNA expression profiling identifies changes in Notch, Wnt, TGF-β and IGF pathways.
mRNA microarray expression data from emerin-null myogenic progenitors was normalized to mRNA expression in wildtype progenitors. Dotted line represents no change in expression. A) Notch pathway. B) Wnt pathway. C) TGF-β pathway. D) IGF pathway. All changes in gene expression were statistically significant (p≤0.05).

