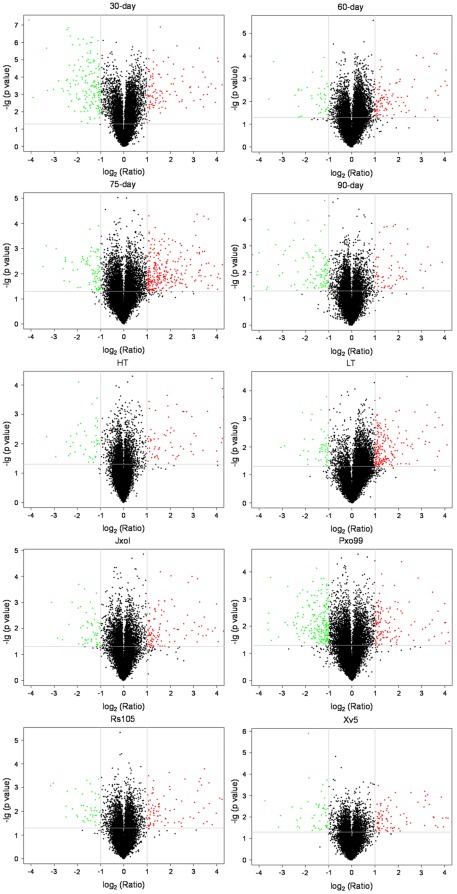
Figure 1. Volcano plots for differentially expressed genes in HH1.
Each point represents a gene detected in microarray analysis. Red spots represent differentially expressed genes with fold change ≥2.0; green spots represent differentially expressed genes with fold change ≤0.5. The log2 (ratio) of expression (HH1/MH63) is shown on the X-axis and the –lg (p-value) is shown on the Y-axis. The vertical lines represent 2-fold change ratio and the horizontal line represents statistical-significance level where p = 0.05. 30-day, 60-day, 75-day, 90-day: HH1 and MH63 at developmental stage of 30-day, 60-day, 75-day, 90-day, respectively; HT: HH1 and MH63 treated with high-temperature at 45°C for 6 hours; LT: HH1 and MH63 treated with low-temperature at 12°C for 6 hours; JxoI, Pxo99: HH1 and MH63 inoculated with X. oryzae pv. oryzae JxoI and Pxo99 strain; Rs105: HH1 and MH63 inoculated with X. oryzae pv. oryzicola Rs105 strain; Xv5: HH1 and MH63 inoculated with non-host pathogen X. compestris pv. vesicatoria Xv5 strain.

