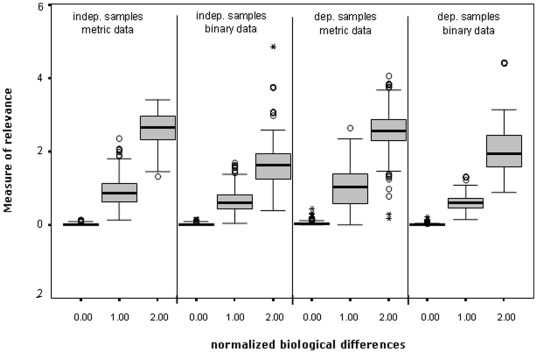
Figure 3. Boxplots of the MoR values under diverse sample designs and data structures.
Irrespective of data type and sample design in the two-sample problem, the measure of relevance shows similar values if the variables are very informative (Normalized Biological Difference (NBD) about  ), semi-informative (NBD about
  ) or non-informative (NBD about
  ).
).

