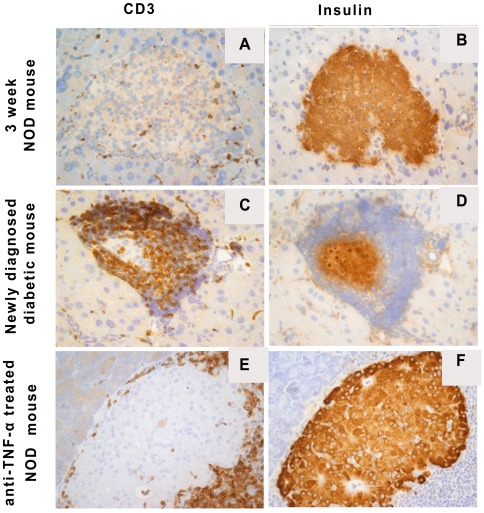
Figure 4. Immunohistochemical staining for CD3 and insulin in NOD pancreatic islets from different experimental groups.
Representative frozen sections from a 3 week old female pre diabetic NOD mouse without insulitis (A, CD3; B, insulin), a newly diagnosed diabetic female mouse (C, CD3; D, insulin) and a diabetic NOD female mouse treated with anti-TNF-α (E, CD3; F, insulin). Overall the figures document increasing cellular infiltration by CD3+ T cells and the associated loss of insulin positive cells in diabetic (C, D), as compared to prediabetic, hosts (A, B). After anti-TNF-α treatment, intra-islet infiltration by CD3+ T cells is abolished with the appearance of a circumferential non-invasive CD3+ T cell process (E). After treatment many islets are found with normal insulin+ beta cells (F).

