Abstract
Purpose: Dedicated breast PET/CT is expected to have utility in local staging, surgical planning, monitoring of therapy response, and detection of residual disease for breast cancer. Quantitative metrics will be integral to several such applications. The authors present a validation of fully 3D data correction schemes for a custom built dedicated breast PET/CT (DbPET/CT) scanner via 18F-FDG phantom scans.
Methods: A component-based normalization was implemented, live-time was estimated with a multicomponent model, and a variance reduced randoms estimate was computed from delayed coincidences. Attenuation factors were calculated by using a CT based segmentation scheme while scatter was computed using a Monte Carlo (MC) simulation method. As no performance standard currently exists for breast PET systems, custom performance tests were created based on prior patient imaging results. Count-rate linearity for live-time and randoms corrections was measured with a decay experiment for a solid polyethylene cylinder phantom with an offset line source. A MC simulation was used to validate attenuation correction, a multicompartment phantom with asymmetric activity distribution provided an assessment of scatter correction, and image uniformity after geometric and detector normalization was measured from a high count scan of a uniform cylinder phantom. Raw data were reconstructed with filtered back projection (FBP) after Fourier rebinning. To quantify performance absolute activity concentrations, contrast recovery coefficients and image uniformity were calculated through region of interest analysis.
Results: The most significant source of error was attributed to mispositioning of events due to pile-up, presenting in count-related axial and transaxial nonuniformities that were not corrected for with the normalization method used here. Within the range of singles counts observed during clinical trials residual error after applying all corrections was comparable to that of a commercial whole body PET/CT system.
Conclusions: The results suggest that DbPET/CT is capable of producing quantitative images under the operating conditions expected during patient imaging.
Keywords: PET/CT, positron emission mammography, dedicated, breast cancer
INTRODUCTION
Several experimental and clinical applications for the management of breast cancer with fluorodeoxyglucose (18F-FDG) whole body (WB) PET rely on quantitative and semiquantitative metrics. The measurement commonly employed is the standardized uptake value (SUV), which is calculated from regions of interest (ROIs) drawn manually on suspicious or known lesions. Researchers have used the change in SUV between a baseline and post-treatment scan to monitor primary therapy response1 and a fixed SUV threshold2 or a change in SUV between two scans performed after a single injection (dual-time-point WB PET) to detect suspicious lesions.3 However, quantitative accuracy is significantly reduced with WB PET when imaging lesions are small. Using dual-time-point WB PET to detect primary breast cancer, Imbriaco et al.4 measured a sensitivity of 88% for lesions >10 mm versus 62% for lesions <10 mm in diameter. This performance deficit has been attributed to partial voluming, limited photon sensitivity, and attenuation from tissue outside the breast, prompting researchers to develop positron emission systems that utilize higher resolution detectors placed closer to the breast than in WB PET for the purpose of dedicated breast imaging.
Clinical trials characterizing dedicated breast positron emission scanning performance have suggested that this modality may have additional uses beyond that of WB PET, including local staging, surgical planning, detection of residual disease, and aiding in pharmaceutical development. Breast positron emission scanners can be divided into two categories based on the completeness of angular sampling (φ) acquired in sinogram space. Breast PET (bPET) cameras5, 6, 7, 8, 9 acquire fully tomographic scans while positron emission mammography (PEM) units10, 11, 12 have limited angular sampling. The ability of PEM to detect breast cancer has been measured in several trials12, 13, 14 with reported sensitivity and specificity ranges of 80%–90% and 86%–100%, respectively. Patient imaging with bPET has been examined in several studies,15, 16, 17 with lesion-based sensitivity and specificity measured at 82%–93% and 100%, respectively, in a trial of 58 female patients with known or suspected breast cancer.16
Although standards exist for estimating quantitative accuracy during patient imaging with WB PET, no standard is currently available for bPET or PEM. Custom performance tests, specific to the scanning and patient geometries employed in dedicated positron emission scanners, have been examined. Researchers estimated the influence of activity from outside the field of view (FOV) on contrast recovery for PEM (Ref. 18) or lesion visibility with bPET (Ref. 19) using an anthropomorphic torso phantom, uniformity, and noise at the edge of the in-plane FOV with line source measurements for PEM (Ref. 20) and contrast recovery as a function of cross-plane position using spheres in a compressible saline bag for PEM.20 Detection limits of PEM were estimated with gelatin breast phantoms and shell-less inserts.21 The NEMA standards have been adapted for measuring breast positron emission imaging performance. Luo et al.22 used the NU 4-2008 small animal PET standard23 directly for a PEM system, while the method for estimating noise equivalent count rates (NECRs) and the scatter fraction in the NU 2-2001 (Ref. 24) guideline was modified for use with a bPET scanner.25
Our group has constructed a custom dedicated breast PET/CT scanner (DbPET/CT) and previously characterized its performance in a clinical trial involving four patients.15 From this previous trial data (seven scans total), in combination with preliminary data assessing the utility of DbPET/CT for monitoring therapy response (three patients and six scans total), the range of operating conditions for DbPET/CT during breast imaging has been estimated (acquisition time = 12.5 min/breast, range of injection activities = [139–477] MBq, and uptake time = [73–94] min). Notably, count losses from dead-time were significant (median percent dead-time = 29.6%) and may be attributed to the large contribution of singles flux (range of energy windowed singles = [413–1135] kcps) from activity outside the FOV (OFOV) combined with the multiplexed detector readout of the electronics. Additionally, results from Boone et al.26 found the 95% range of breast diameters = [10.1–18.1] cm, suggesting that as in WB PET imaging attenuation will dominate image bias. Using the operating conditions from patient imaging as a guide, we developed custom performance measurements to validate data correction schemes for DbPET/CT.
MATERIALS AND METHODS
System description
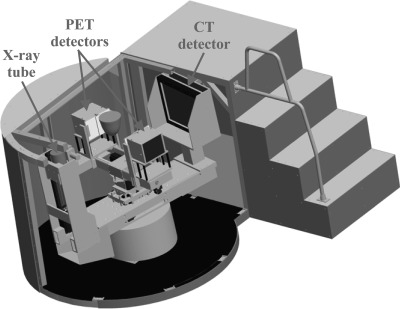
A thorough description of DbPET/CT and its basic performance measurements has been reported for both the PET (Refs. 5, 15) and CT (Ref. 27) components. An image of the current system is shown in Fig. 1. Briefly, the PET camera has dual-planar square heads (face dimension = 12 cm) each composed of 4 × 4 lutetium oxyorthosilicate-based arrays (crystal size, 3 × 3 × 20 mm) read out by position-sensitive photomultiplier tubes (PS-PMTs). A resistive network multiplexes the modules such that there are only four channels (2X and 2Y) per head. PET electronics simultaneously acquire prompts and delayed coincidences, as shown in Fig. 2. Of particular note are computer controlled nuclear instrumentation module (NIM) counters, used in dead-time correction, that estimate the rate of singles for both heads ( and ), prompts (), and delayed coincidences (). A custom gantry allows for control of PET detector rotation (θ) around the center FOV (CFOV), separation distance, and vertical height. The CT component is composed of a 40 × 30 cm CsI detector (1024 × 768 pixels at 2 × 2 binning) (PaxScan 4030CB; Varian Medical Systems), tungsten target x-ray tube (Comet AG), and custom rotational gantry. For acquisition PET heads rotate in a step-and-shoot motion (40 steps with a step), while the CT acquires data continuously over a rotation.
Figure 1.
Schematic depicting DbPET/CT. The object between the PET detectors shows the approximate position of a subject’s breast during scanning.
Figure 2.
Schematic of PET electronics used for prompts and randoms DAQ trigger generation. Starting from the top left, four pre-amp signals from a detector head are summed and fed into a CFD. Singles triggers () are run through coincidence logic with no offset for prompts or delayed by 32 ns for one head for delayed coincidence trigger generation. Computer controlled NIM counters are used to estimate rates of singles for both heads (), prompts (), and delayed coincidences ().
Correction methods
Overview
An estimate of the relative activity () for a line of response (LOR) formed by transaxial crystal element i and ring u in detector head 1 and crystal j and ring ν in detector head 2 at detector angle θ for DbPET/CT is given by
| (1) |
where is the sinogram of prompts, and are estimates of the randoms and scatter sinograms, respectively, is the product of detector efficiency factors, are the geometric efficiency factors, are the attenuation correction (AC) factors, are the interprojection decay correction terms, and are the system live-time factors. An unconventional data acquisition (DAQ) scheme for DbPET/CT necessitated the development of custom dead-time and randoms corrections, while the attenuation method has largely been adapted from prior literature. The Monte Carlo (MC) scatter estimation method developed in this study is specific to the DbPET/CT geometry, and we propose a generally applicable algorithm to estimate optimal simulation time based on the coefficient of variation in the experimentally acquired PET data. The component based normalization method developed here exploits the symmetries of the flat detectors of DbPET/CT for variance reduction of geometric efficiency factors. A detailed description of each correction method follows.
Normalization
A component based method is used to compute normalization factors for individual LORs. Geometric efficiencies (), which account for solid angle coverage and crystal attenuation path length, are estimated with a MC simulation using simset.28 The MC model of the scanner accounts for coherent scatter in the detectors, air gaps between crystals, and assumes an energy resolution of 25% at 511 keV.5 A high count simulation of a plane source is executed, with the detector heads at a single angular position parallel to the source, and only true coincidences (those not undergoing scatter in the object) falling in a 350–650 keV energy window are recorded. To reduce variance in the geometric efficiencies, the symmetries of the planar detector geometry are exploited. All with the same ring () and transaxial crystal difference () are averaged resulting in a variance reduction factor of
| (2) |
where and are the number of rings and transaxial crystal elements, respectively. In addition, transaxial (for ) and axial (for ) symmetries can be applied resulting in a total variance reduction factor of up to . For the PET component of DbPET/CT, with and , a maximum variance reduction factor of 4900 is achieved in compared to the case where no averaging is used. Averaging of for LORs between modules is permitted as inter detector dead space is minimized via optical fiber bundles29 and a crystal pitch of 3.3 mm is assumed throughout the whole PET head. The product of detector efficiencies () are estimated from a high count experimental acquisition of a uniformly filled plane source for the detector heads at a single angular position parallel to the source. Raw prompts are corrected for , path length through the source, and attenuation before variance reduction using the fully 3D Casey method.30
For all experiments for which normalization was applied, were calculated from a simulation resulting in a variance equivalent of 513 × 106 recorded trues. Computation of was performed from a scan of an 18 mm thick plane phantom (total acquisition time = 820 min) with a maximum initial activity of 5.2 MBq (18F-FDG) resulting in a total of 233 × 106 prompts.
Dead-time
Live-time (LT) for energy windowed prompts is computed on a projection-by-projection basis using a multicomponent model based on Ref. 31. The total system LT is estimated as follows:
| (3) |
where and are the incident singles rates on heads 1 and 2, respectively, is the prompts rate recorded by the NIM counters, and , , and model dead-time losses due to trigger induced pile-up, energy related pile-up, and the coincidence DAQ, respectively. All rates represent those before energy windowing and are only influenced by the voltage trigger threshold of the constant fraction discriminator (CFD). The inability of DbPET/CT electronics to acquire energy information for singles before coincidence detection has led to the use of a multicomponent model for dead-time and pile-up count losses. Dead-time due to overlapping trigger pulses alone (loss of one or more counts) is modeled by , while count losses due to both overlapping trigger pulses combined with a summation of energy greater than the upper level discriminator (ULD) (loss of two or more counts) are accounted for by . Equations for the individual LT components are as follows:
| (4) |
| (5) |
| (6) |
where , , , and are characteristic dead-time coefficients.
Coefficients , , and were estimated in Ref. 5 and are equal to 141 ns, 150 ns, and 3.51 μs, respectively. Estimation of was accomplished by scanning a right cylinder phantom (OD = 7.5 cm, height = 11.1 cm) filled uniformly with 18F-FDG (initial activity = 37.0 MBq) periodically over the course of 18 half-lives. Energy windowed prompts rates recorded from the DAQ () as a function of acquisition time (t) were corrected as follows:
| (7) |
where is the rate of energy windowed trues and scatters with all dead-time corrections except and is the rate of the corrected randoms as estimated in Eq. 8. Incident energy windowed prompts () were estimated by a linear least-squares fit of versus at a low activity range. A value of 103 ns for was calculated by fitting Eq. 5 to the ratio of over as a function of .
Randoms
Patient imaging results have shown that variance reduced randoms subtraction can increase NECR by up to 75% (average = 41%).15 Variance reduced randoms sinograms () are estimated from delayed coincidences on a projection-by-projection basis with
| (8) |
where is the raw energy windowed delayed coincidences, is the randoms rate recorded by the delayed coincidence NIM counter, and and are the acquisition times for a step recorded by the prompts and randoms DAQ, respectively. The first term on the right-hand side of Eq. 8 performs variance reduction on delayed coincidences using the fully 3D implementation of the Casey and Hoffman method.30 The amount of variance reduction is related to the number of LOR summed over. For the results presented here, the limits were set to include all crystals in both detector heads. In Eq. 8, two correction terms are used to account for the differences caused by acquiring prompts and randoms on separate DAQ boards (see Fig. 2). The middle term on the right-hand side of Eq. 8 adjusts the recorded randoms to exhibit the same dead-time as the prompts, while the last ratio accounts for the slight variations between the user specified and recorded ( and ) acquisition times for each DAQ board.
Attenuation
Attenuation correction factors (ACFs) are calculated with a CT based segmentation method based on Ref. 32. Figure 3 shows the process for ACF estimation using a patient data set. CT images are segmented with an intensity based method into air and tissue compartments, with tissue assigned a uniform linear attenuation coefficient (). Segmentation intensity thresholds were specified by the user in this study. To match the average resolution of the PET image, the segmented CT image volume is convolved with a 3D Gaussian blurring kernel ( voxels) with full width at half maximum (FWHM) set to 3.3 mm.5 Blurred images are registered and downsampled to PET with an a priori computed affine transform and trilinear interpolation.15 As the CT transaxial FOV (20 cm) is significantly greater than that of the PET (12 cm), registered images are padded to match the X-Y (transaxial plane) dimensions of the CT, minimizing potential artifacts from breast tissue outside the PET FOV. ACFs are computed by forward projecting the segmented images into PET sinogram space with an implementation of the Siddon algorithm.33
Figure 3.
CT based ACF estimation for a patient image set. (a) The original CT image, (b) the segmentation of (a) to a uniform linear attenuation value and resolution matched to the PET, (c) the registration of (b) to the PET reference frame, and (d) the forward projection of (c) into sinogram space. The line in (c) denotes the approximate coronal slice for which the sinogram in (d) corresponds.
Scatter
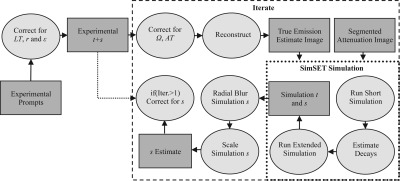
Scatter () is estimated in full 3D using the MC simulation software SIMSET (Ref. 28) (see Sec. 2B2 for a description of the simulation model). Figure 4 shows a schematic of the complete scatter estimation method. For the MC portion of the scatter algorithm, the attenuation map is estimated from the segmented CT image as in Sec. 2B5. MC correction methods are inherently more computationally expensive compared to analytic, dual-energy, convolution, or tail fitting approaches and as such suffer from a computation time versus noise trade-off. Optimally, simulation time, or total number of decays, should be adjusted on an acquisition-by-acquisition basis such that the noise of the scatter estimate is significantly less than the noise of the experimental scatter data. We propose the following equation for estimating the number of decays () to simulate based on the coefficient of variation (CoV) of the experimental sinogram:
| (9) |
where is the number of decays used in a short simulation (see Fig. 4), is the CoV for the scatter sinogram of the short simulation, is the CoV for the experimental trues and scatters, SF is the scatter fraction for the acquisition as estimated from the short simulation, and f is a parameter that determines the reduction in CoV for the scatter estimate with respect to the experimental data. The CoV estimates represent the average value over all θ for all LORs passing through the object as determined through the ACF. The MC scatter estimation can be run iteratively producing a progressively more accurate scatter estimate as a function of the iteration number. At the end of each iteration, is computed by radially blurring the MC scatter sinogram () with a user specified Gaussian kernel and scaling the result to match the experimental data as follows:
| (10) |
where is the radially blurred MC scatter, is the MC trues, is the experimental prompts sinograms, and the summations are over the complete sinogram space. The argument of the summation in the numerator of Eq. 10 is equal to the inverse of in Eq. 9. To reduce computation time, the code has been written such that multiple MC simulations can be run in parallel.
Figure 4.
Schematic of the MC scatter estimation. Key: t = trues sinogram, s = scatters sinogram, r = randoms sinogram, AT = attenuation, Iter. = iteration number.
Validation experiments
General acquisition and data processing
All data were acquired, or simulated, with a detector separation distance (crystal face-to-face) of 26.3 cm, which has been found to be the minimal distance allowing for PET detector rotational clearance when the patient is positioned to maximize CT breast and chest wall coverage.15 PET prompts and delayed list-mode data were subjected to a 350–650 keV energy window (crystal-by-crystal basis). For reconstruction 2D filtered back projection was used after Fourier rebinning (FORE),34 with a maximum ring difference of 35, and radial frequency (), angular frequency (), and ring difference () limits all equal to 5. All correction and measurement code was written in C/C++ and MATLAB® (The MathWorks, Inc.).
Dead-time and randoms
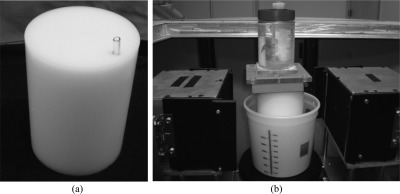
Count-rate linearity, after correcting for dead-time and randoms, was assessed with a solid high density polyethylene (HDPE) right cylinder (OD = 10.2 cm) with offset line source, as shown in Fig. 5a. The phantom was filled with 18F-FDG and scanned by PET with 20 min acquisitions (25 min duty cycle) for 10 half-lives (initial activity = 18.5 MBq). As only the open energy windowed singles rates are recorded ( and ) and used for correction in Eqs. 5, 4, factors may have reduced accuracy if the energy distribution of singles around the ULD varies for a given value of (e.g., through a significantly different source distribution than used for estimation). This potential inaccuracy was tested by imaging the HDPE cylinder as positioned previously with a uniformly filled jar placed OFOV (total initial activity = 37.0 MBq) (ratio of activity = 1:1) as shown in Fig. 5b. Images were reconstructed with data sets uncorrected or corrected for combinations of dead-time and randoms, and residual error between incident and corrected counts was calculated based on Ref. 24.
Figure 5.
Phantoms used for the assessment of dead-time and randoms correction accuracy. (a) HDPE right cylinder with line source offset 3.8 cm from the center alone or (b) combined with a uniform filled cylinder (outer diameter = 7.5 cm, height = 11.1 cm) placed outside the FOV. The position of the phantoms with respect to the detector heads is visible in (b).
Attenuation
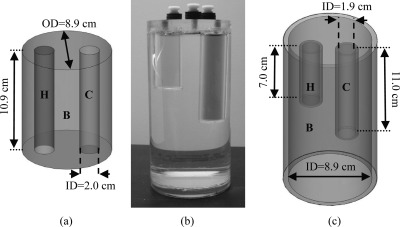
Accuracy of the CT based attenuation correction method was calculated with a MC simulation of DbPET/CT using SIMSET. The scanner simulation model was the same as that used for normalization (see Sec. 2B2). High count acquisitions were simulated for a right cylinder phantom with an activity map consisting of uniform background (B), hot (H), and cold (C) rod compartments and attenuation map of solely air or uniform water filled background. Figure 6a depicts a schematic of the simulated activity distribution. Concentration ratios were set at 4.8:1:0 for H:B:C. ACF estimation was performed with the voxelized water filled attenuation map as input and only true events (those not undergoing Compton scatter in the phantom) reconstructed. To compare reconstructed images of the air (ground truth) and water filled phantoms, profiles were drawn and ROI analysis performed on the rods and background.
Figure 6.
Phantoms used for attenuation validation and assessment of accuracy for scatter correction. (a) Schematic of digital phantom used in attenuation validation, with hot (H), background (B), and cold (C) compartments. (b) Photograph and (c) schematic of fillable acrylic phantom used for assessing scatter correction accuracy. Key: OD = outer diameter, ID = inner diameter.
Scatter
The accuracy of the scatter and attenuation corrections was assessed using a water filled cylindrical acrylic phantom containing hot rod (H), cold rod (C), and background compartments (B). Figures 6b, 6c depict the custom made scatter phantom which was based on Ref. 35 and allows for an asymmetric distribution of activity both transaxially and axially. The scatter phantom was filled with 11.1 MBq of 18F-FDG, offset transaxially by 1 cm, and scanned by PET with 20 min acquisitions (25 min duty cycle) for five half-lives and by CT (tube voltage = 80 kVp, tube current = 7.0 mA). The activity concentration ratios were set as follows H:B:C = 5:1:0. The background compartment (B) was partially filled (total filled height of B = 12 cm) and the phantom inverted such that all activity was within the FOV of the scanner. CT images were segmented into regions with linear attenuation coefficients of air, water, and acrylic and ACF calculated as in Sec. 2B5. Scatter correction was performed for a total of three iterations on sinograms summed over all acquisitions. For a qualitative assessment of scatter correction accuracy, profiles were drawn through the rods and background of images reconstructed with or without scatter correction as well as the scatter estimate itself. Bias after scatter correction was estimated by drawing ROIs on the rods and background of reconstructed images and calculating contrast recovery coefficients (CRCs) for the cold () and hot () rods as follows:
| (11) |
| (12) |
where , , and are values for the cold, hot rod, and background ROIs, respectively, and R is the expected activity concentration ratio between the hot rod and background compartments.
Image uniformity
Quantification of artifacts induced by normalization and image uniformity after all corrections was performed with a high count scan of a fillable right cylinder phantom, as shown in Fig. 5b. The phantom was centered axially and offset 1.5 cm transaxially in the FOV and scanned by PET with 20 min acquisitions (25 min duty cycle) for a total acquisition time of 20 h. The phantom was filled with a total of 13 injection doses during the 20 h acquisition time, to maximize recorded counts, with the range of activity in the phantom (3.0–11.8 MBq) during imaging chosen such that global singles rates summed for both heads were within the limits observed during patient imaging (see Sec. 1).
In order to compare image uniformity between DbPET/CT and a commercial WB PET scanner, a right cylinder phantom (OD = 21 cm, height = 17 cm) was scanned with a GE Discovery ST PET/CT (GE Medical Systems, Milwaukee, WI). The phantom was filled with 143 MBq of 18F-FDG, centered axially and offset 2.8 cm transaxially in the FOV, and imaged for a total of 12 h. All data corrections were applied and the images were binned with FORE and reconstructed with FBP using the manufactures software.
As the DbPET/CT electronics are not capable of PMT signal baseline restoration, crystal positions in detector flood histograms have been shown to change significantly due to baseline variations, mainly as a function of time. Due to the relatively long time scale of the image uniformity data acquisition, in comparison with the other validation experiments, we predicted that time based baseline changes would produce artifacts in the reconstructed images if not corrected for. Postprocessing baseline restoration was implemented by generating separate crystal lookup tables for flood histograms created from 3 h prompt frames. Each individual prompt list-mode frame was then processed with its corresponding crystal lookup table to produce framed sinograms, and a single merged sinogram from all frames was generated and processed as described elsewhere.5
Transaxial and axial image uniformities were qualitatively assessed by drawing profiles through the reconstructed images. A quantitative analysis of uniformity was performed by drawing concentric semiannular ROIs with center of rotation set at the center of the PET FOV. The angular position and central angle subtended by each semiannular ROI were adjusted such that ROIs were entirely within the phantom, as determined by a larger circular ROI centered transaxially on the phantom.
Image quality
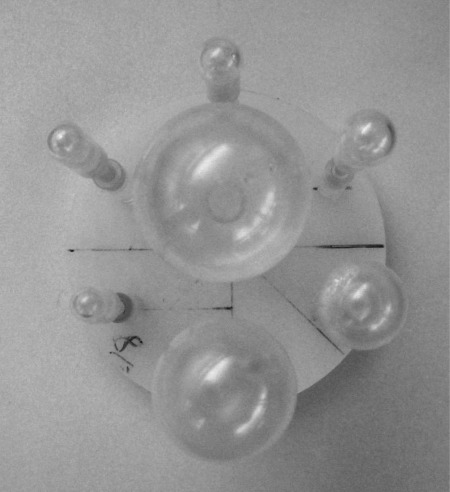
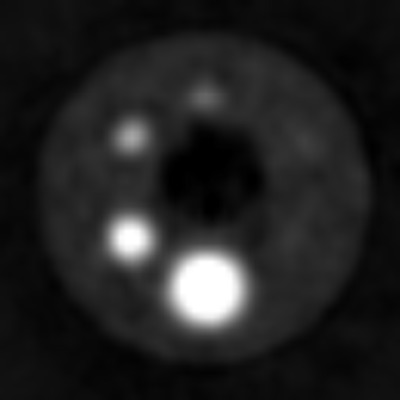
The accuracy of all corrections combined, for a range of structure sizes, was assessed with a phantom based on that used in the NEMA NU 2-2001 standards image quality exam.24 The phantom consisted of an insert containing fillable spheres with a range of internal diameters (4.0–29.0 mm) placed in a fillable right cylinder [see Fig. 5b]. Figure 7 shows a photograph of the sphere insert. The phantom was filled with 8.0 MBq of 18F-FDG, placed at the transaxial CFOV, and scanned by PET with 20 min acquisitions for two half-lives. The activity concentration ratio was set to 8:1 between the spheres and background for all spheres except that with the largest internal diameter (ID), which was set to 0:1. Image accuracy was estimated by placing ROIs on the spheres and background compartments and calculating and using Eqs. 11, 12, respectively.
Figure 7.
Photo of the fillable sphere insert used in the image quality assessment (see Sec. 2C6).
RESULTS
Dead-time and randoms
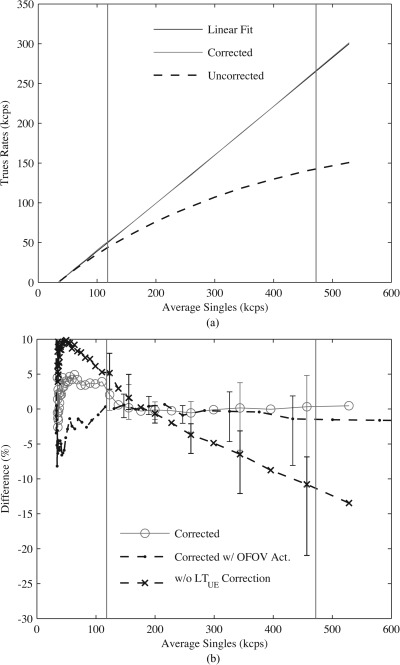
Incident event rates, as a function of singles, were estimated on a slice-by-slice basis from linear fits of values from ROIs (diameter = 9.6 cm) drawn on a total of 61 transaxial slices. Images were corrected for both randoms and combinations of the live-time models in Sec. 2B3 and linear fitting was done over six sequential acquisitions with singles rates (averaged over detector heads and acquisitions) greater than or equal to minimum observed during patient imaging (see Sec. 1). Figure 8a compares the incident event coincidences (linear fit), averaged over all image slices, with corrected or uncorrected data as a function of singles. Data without randoms or dead-time corrections greatly underestimated incident count rates compared with corrected images. Figure 8b assesses the contribution of the individual components in the LT model in Eq. 3 to the residual error as a function of singles. When no correction was applied (corrected w/o ), a maximum residual error of −21.0% was recorded at a singles rate (457 kcps) approaching the maximum observed during patient imaging, compared with a value of −11.1% at the same singles rate for the case of full LT correction (corrected). The accuracy of the LT model for different activity distributions is also examined in Fig. 8b. Including activity OFOV (corrected w/ OFOV Act.) was found to not increase residual error over the case of activity in the FOV alone (corrected). Regardless of the LT correction employed, or the activity distribution used, the range of residual error values increased as a function of singles rates due largely to the negative bias of ROIs, with respect to the incident count rates, for transaxial slices at both extremes of the axial FOV. Table TABLE I. compares root mean square error (RMSE) averaged over singles observed during patient imaging. A maximum RMSE of 4.8% was measured for data fully corrected for dead-time and randoms versus 27.7% for data with no corrections.
Figure 8.
Accuracy of dead-time and randoms corrections. (a) Trues and scatters versus estimate of average energy windowed singles for incident rates (Linear Fit), data fully corrected for dead-time and randoms (Corrected), and data without any corrections (Uncorrected). (b) Residual error between incident and fully corrected prompts ROIs for activity inside the FOV alone (corrected) or with additional activity OFOV (corrected w/ OFOV Act.), or with activity inside the FOV alone and all corrections except (w/o correction). Vertical lines indicate approximate range of singles observed during patient imaging, and error bars show min and max differences across the axial FOV.
TABLE I.
Mean (over all axial slices) and max RMSE (%) residual error measured after combinations of dead-time and randoms corrections.
| Metric | Uncorrecteda | Corrected | Corrected w/ OFOV Act. | Corrected w/o b |
|---|---|---|---|---|
| Mean | 24.9 | 1.4 | 1.1 | 5.4 |
| Max | 27.7 | 4.8 | 3.6 | 9.6 |
No data corrections.
All corrections for randoms and dead-time except for energy related pile-up.
Attenuation validation
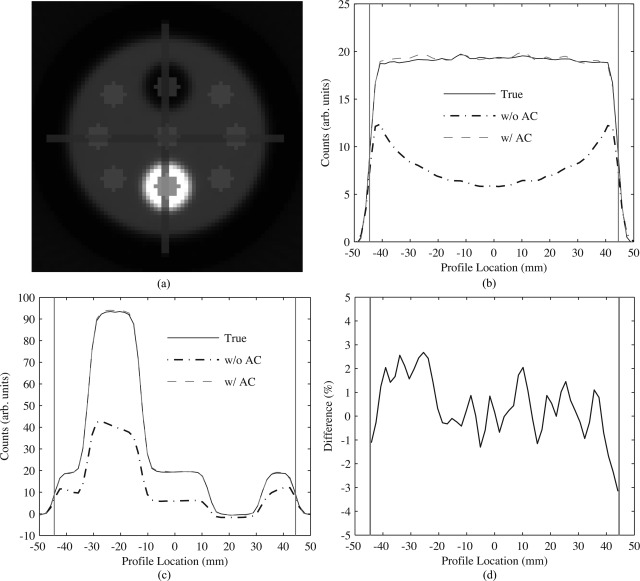
Figure 9 shows the performance analysis of the calculated AC method. Images were reconstructed from simulation data with a variance equivalent of 203 × 106 recorded trues. Line profiles were generated by averaging voxel intensities from ROIs (thickness = 3.4 mm, axial depth = 51 slices) drawn through background and cylinder compartments. Profiles for images with AC (w/ AC) agree well with those taken from reconstructed images of simulations using an attenuation map solely of air (true), as shown in Figs. 9b, 9c. Figure 9d shows that the difference between the true and AC images for line profiles of the background segment was a maximum of −3.2% at the edge of the transaxial extent of the phantom, with RMSE over the complete extent of the phantom measured at 1.3%. Table TABLE II. shows the activity concentration calculated from 10 mm diameter ROIs drawn on a total of 51 transaxial slices for AC and true images for the hot rod, cold rod, and background regions. The difference between AC and true ROI mean values was less than 4% of the background for all compartments.
Figure 9.
Accuracy of attenuation correction as determined through MC simulations. (a) Transaxial reconstructed image of the activity distribution with an all air attenuation map (true) depicting position of line profiles and circular ROIs. Comparison of transaxial line profiles drawn through the (b) background and the (c) hot and cold cylinders of the phantom. (d) Percent difference of background profiles between the true and AC images. Vertical gray lines on (b)–(d) represent the transaxial extent of the phantom.
TABLE II.
ROI measurements of activity concentration (counts/ml) (mean ± intertransaxial slice σ) from true and attenuation corrected (AC) cylinder phantom images.
| Method | Hot rod | Cold rod | Background |
|---|---|---|---|
| True (air μ-map) | |||
| w/ AC |
Scatter
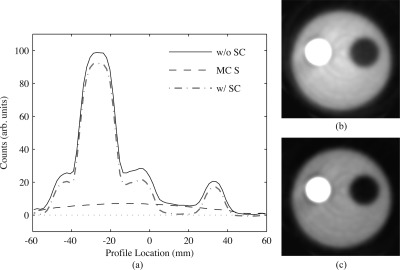
Figure 10 shows the performance of the MC based scatter correction on high count data (total prompts = 174 × 106) acquired from a phantom with asymmetric activity distribution. For the scatter correction, radial blurring of the scatter sinogram was performed with a Gaussian with FWHM = 22.9 mm, and the desired CoV of the blurred scatter sinogram with respect to the experimental data (f) set to 0.25 [see Eq. 9]. Figure 10a shows 1.7 mm thick line profiles drawn through the center of hot and cold rod compartments for data corrected or uncorrected for scatter, and the MC scatter estimate itself (). Agreement between and the cold regions of the phantom for the image without scatter correction is excellent. A qualitative decrease in cold rod compartment residue is visible in reconstructed transaxial images, as shown in Figs. 10b, 10c.
Figure 10.
Scatter correction performance for experimental scans of a phantom with asymmetric activity. (a) Comparison of transaxial line profiles drawn through the cold and hot cylinders for reconstructed images with (w/ SC) or without (w/o SC) scatter correction, and the MC scatter estimate itself (MC S) after two iterations of scatter estimation. (b) Reconstructed transaxial images without scatter correction and (c) with scatter correction, with display window upper limit = 35% of maximum. Profiles and images were averaged over 30 transaxial slices.
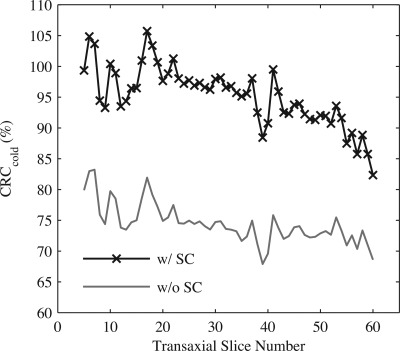
Table TABLE III. lists the cold () and hot () CRC values for images with or without scatter correction and as a function of the scatter estimate iteration number. Values were estimated from 3.4 mm diameter ROIs, with 1 each on the cold and hot rod compartments and 6 arranged on the background, over a total of 30 transaxial slices. Scatter correction significantly improved both and , although residual error was larger for the hot rod compartment. Contrast recovery was optimal after a total of two iterations for the scatter estimate, although not significantly compared to results after one iteration. Figure 11 shows as a function of transaxial slice number. Values were estimated as in Table TABLE III., but the number of transaxial slices examined was extended to cover the complete cold rod compartment. Average across this extended axial FOV was , with reduced contrast closer to the boundary separating the cold rod and uniformly filled compartments.
TABLE III.
CRCs (%) (mean ± intertransaxial slice σ) for images of an asymmetric activity distribution with or without scatter correction.
| Method | ||
|---|---|---|
| w/o SC | ||
| w/ SC, iteration 1 | ||
| w/ SC, iteration 2 | ||
| w/ SC, iteration 3 |
Figure 11.
Mean as a function of transaxial slice number taken over the entire length of the cold compartment for a phantom containing asymmetric activity distribution. Results are for images reconstructed with all corrections excluding (w/o SC) or including (w/ SC) scatter correction. The 60th transaxial slice represents the approximate edge of the cold rod compartment and the warm background.
Image uniformity
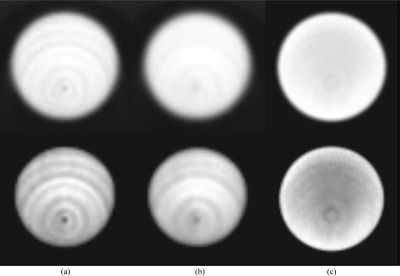
Reconstructed images for a high count acquisition of a uniformly filled phantom acquired both on DbPET/CT and on a commercial WB PET/CT are shown in Fig. 12. After all corrections were applied a low frequency, low magnitude, concentric ring and cold spot artifact, with center at the CFOV, were visible. Qualitatively, application of postprocessing baseline restoration dramatically reduced the magnitude of image artifacts [compare Figs. 12a, 12b].
Figure 12.
Transaxial images of a uniformly filled phantom from a high count scan on DbPET/CT and the GE Discovery ST. All images were corrected for LT, attenuation, randoms, scatter, and normalization. (a) Images without and (b) with postprocessing baseline restoration and (c) acquired from a WB PET/CT scanner. Top row: gray scale windowing set to the full dynamic range. Bottom row: gray scale minimum set to 70% the image maximum. DbPET/CT and GE Discovery ST images are an average of 41 and 27 transaxial slices, respectively (same fractional axial FOV).
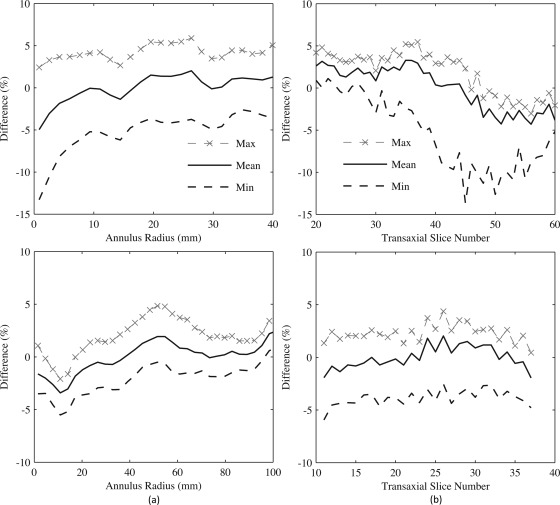
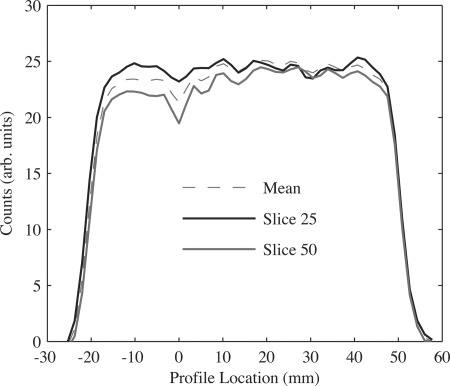
To quantify the magnitude of the ring artifact on transaxial and axial uniformities, concentric semiannular ROIs (DbPET/CT: total of 24 rings with thickness = 1.7 mm; WB PET/CT: total of 33 rings with thickness = 3.12 mm), centered at the CFOV, were drawn on transaxial images. Figure 13a shows that ROI bias, with respect to the volume mean, was the greatest absolute magnitude (13.3%) closest to the CFOV for DbPET/CT (compared to −5.5% just off the CFOV for WB PET/CT). Minimum (most negative) RMSE across the transaxial FOV was 5.8% for DbPET/CT with all corrections compared with 2.6% for WB PET/CT. The change in the annular ROI values as a function of transaxial slice number is depicted in Fig. 13b. The difference in the ROI at the CFOV with respect to the volume mean was found to increase at larger transaxial slice numbers. Minimum RMSE across all transaxial slices was 9.9% and 7.0% for DbPET/CT without or with, respectively, application of postprocessing baseline restoration (compared to 4.0% for WB PET/CT). A further analysis of the ring artifacts was performed by drawing 3.4 mm thick line profiles vertically through the transaxial CFOV at several transaxial slice positions for DbPET/CT, as shown in Fig. 14. Consistent with the annular ROI results in Fig. 13b, the cold spot artifact at the CFOV increases with respect to the volume mean at several higher transaxial slice numbers.
Figure 13.
Assessment of image uniformity after all corrections for a uniformly filled phantom on DbPET/CT (top row) and the GE Discovery ST. (a) Difference of mean annular ROI values, with respect to the volume mean, taken across the transaxial FOV. Min and max were computed from mean ROI values at a given radius across all images slices, and the CFOV is at an annular radius = 0. (b) Mean of all voxels covered by annular ROIs on a slice-by-slice basis. Min and max were calculated from mean annular ROI values across the transaxial image plane for a given transaxial slice.
Figure 14.
Comparison of transaxial line profiles drawn through reconstructed images of a uniform cylinder after all corrections. Profiles shown include an average taken over 41 slices (Mean) and at two different transaxial slice numbers. The transaxial CFOV is at a profile location of 0. Slice numbers correspond to those in Fig. 13b.
Image quality
Contrast recovery coefficients were calculated for the quality phantom by drawing ROIs on each sphere (ROI diameter = sphere ID) for a transaxial slice passing through all the spheres. Five 5 mm diameter ROIs were placed on the background compartment for each transaxial slices around the sphere centered slice (total of 25 background ROIs). Parameters for the scatter correction were the same as those in Sec. 3C. Table TABLE IV. lists CRCs for the quality phantom for several combinations of corrections. The results are from images corrected for scatter with a scatter estimate calculated after three iterations. After all corrections and for the 29 and 22 mm ID spheres, respectively, were comparable to the measurements from the scatter validation (see Table TABLE III.). values were found to be proportional to sphere ID, which may likely be attributed to partial voluming. Figure 15 shows a transaxial image of the quality phantom with all corrections applied.
TABLE IV.
CRCs (%) for the quality phantom after various corrections. was calculated for the cold sphere with ID = 29 mm, while was calculated for all remaining spheres. Corrections are cumulative descending a column.
| Sphere ID (mm) | |||||||
|---|---|---|---|---|---|---|---|
| Corrections | 29.0 | 22.0 | 13.0 | 7.9 | 6.2 | 5.0 | 4.0 |
| None | 82.6 | 51.5 | 30.5 | 24.1 | 14.1 | 9.3 | 2.3 |
| Randoms | 84.3 | 53.3 | 31.1 | 23.4 | 14.4 | 9.4 | 1.5 |
| Attenuation | 42.2 | 63.0 | 40.0 | 32.4 | 21.5 | 13.4 | 6.3 |
| Scatter | 89.2 | 91.2 | 55.9 | 43.1 | 27.0 | 17.4 | 6.9 |
| Geometric norm | 86.1 | 93.3 | 57.0 | 44.3 | 28.7 | 17.7 | 7.4 |
| Crystal efficiency norm | 86.8 | 96.9 | 58.8 | 46.0 | 28.6 | 17.7 | 7.4 |
Figure 15.
Reconstructed transaxial quality phantom image with display window upper limit = 80% of the slice maximum and all corrections applied.
DISCUSSION
The performance of multicomponent LT and variance reduced randoms corrections was assessed as a function of singles rates and source distributions. RMSE measured over singles rates observed during patient imaging was found to not increase with the addition of activity placed OFOV (Table TABLE I.). This finding suggests that the relationship between counter based singles rates ( and ) and energy related pile-up losses, as estimated by , is not sensitive to the source distribution. The range of residual errors over the axial length of the phantom were found to increase significantly as a function of the singles rate [Fig. 8b], due largely to the negative bias of ROI values, with respect to the incident count rates, at the axial extremes of the FOV. Pile-up effects have been shown to preferentially misposition events toward the center of the detector block in a count-rate dependent manner.36 The multiplexed large area detector readout used in DbPET/CT, in combination with acquisition electronics that lack pile-up prevention circuitry, makes this system particularly susceptible to such pile-up effects.
Several factors motivated us to use a segmentation based calculated attenuation correction method, as opposed to an approach that scales Hounsfield units (HU) directly to ,37 for the current implementation of DbPET/CT. For CT images, an intrasubject bias of has been measured, which could propagate into significantly reduced PET SUV accuracy if the scaling approach were employed. Furthermore, scaling methods have been shown to have reduced accuracy when using contrast-enhanced CT, and preliminary results suggest that breast CT with contrast-enhancement may offer superior detection of smaller in situ lesions compared to breast CT without contrast and may offer equivalent diagnostic information to contrast-enhanced MRI.27, 38 Although inaccuracies due to contrast in ACF estimation with the scaling approach have been shown to be significant only for thoracic imaging with WB PET/CT,39 a similar study has yet to be done with the very different operating conditions of DbPET/CT. For WB PET imaging, the segmentation approach has been shown to produce bias in reconstructed PET images for regions of the body where tissue density gradually changes (e.g., in the lungs); however for bPET scanning, this may not be a severe limitation as breast tissue has significantly greater homogeneity in linear attenuation coefficients compared to the problematic regions encountered in typical WB exams.
A limitation when using the CT for attenuation correction, regardless of the method, is the potential spatial mismatch between PET and CT images. Accuracy of ACF estimation has been shown to be most sensitive to inaccurate registration between emission and attenuation maps.40 For a clinical trial of four patients with DbPET/CT, in which no immobilization of the breast was used, one set of PET images was not interpretable due to misregistration between the PET and CT.15 Segmenting the reconstructed PET volume instead of the CT implicitly reduces this problem; however, mild compression of the breast is another potential solution and we plan on implementing an immobilization scheme comparable to that used in breast MRI.41 Furthermore, it is expected that the larger transaxial FOV (20 versus 12 cm) and the significantly higher SNR of images from the CT compared with the PET will allow for more accurate segmentation of the breast volume.
Performance of a MC based scatter correction method was explored for data acquired from a phantom with rods containing asymmetric activity distribution and a sphere phantom. Mean residual error after three iterations was <10% for both and for the rod phantom (see Table TABLE III.), and for for the largest hot sphere of the quality phantom (see Table TABLE IV.). Studies using an alternative MC implementation42 and a single-scatter simulation (SSS) approach43 with similar phantoms have measured comparable residual error. The scatter estimation code used here has not been fully optimized for computation time. Using the CoV scaling approach (see Sec. 2B6) with f = 0.1, for a 12.5 min patient breast scan, time per iteration on a cluster with 2.7 GHz Core™ 2 Duo Processors (Intel Corporation) was ≈11 min, with <1 min of overhead to condition data before iterating. We have used importance sampling techniques44 to improve MC simulation efficiency, although we expect computation time to be further reduced with coarser attenuation map sampling and parallelization of acquisitions in the simulation environment itself.
Although we chose a MC implementation, the optimal scatter correction for bPET imaging requires further study. The large fraction of the PET FOV occupied by the breast might significantly limit the accuracy of tail fitting approaches45 and the performance of dual energy window methods35 could be reduced by the relatively low energy resolution (25%) of DbPET/CT and the large range of breast dimensions.15 A convolution-subtraction method has been tested for a bPET scanner, showing minimal residual bias for a phantom analysis.25 A known limitation of MC and SSS methods is an inability to account for activity from OFOV that is not directly imaged by both PET and CT. The scanner and prone patient positioning geometry used in DbPET/CT inherently limits the ability to acquire emission measurements for tissue outside of the breast, and OFOV activity was not accounted for in this MC implementation. Simulation studies for a bPET system with improved chest wall coverage, lower average energy resolution, and higher photon sensitivity than DbPET/CT, however, revealed that the contribution to the total SF from OFOV activity is expected to be negligible.46
Several artifacts were evident in images of a uniform cylinder even after application of all corrections. Most visible was a low magnitude concentric ring pattern (Fig. 12), which has been noted previously in other PET scanners.47, 48 For a rotating dual-head PET system, Conti et al.49 found this type of artifact to be significantly reduced in both the transaxial and axial directions by using count-rate-matched normalization coefficients. Average singles rates for the phantom scans used in detector efficiency calculation and estimation of image uniformity were 92 and 285 kcps, respectively, indicating that limited count-rate-matching may have been a degrading factor. The mispositioning of events due to pile-up was suspected in the axial direction for the performance assessment of dead-time and randoms corrections and may explain the rate-dependent change in transaxial detector efficiency factors () observed here. A cold spot at the transaxial CFOV was also observed, which was significantly greater than the magnitude of a similar cold region artifact observed in a GE Discovery ST. The MC estimated geometric efficiency factors () used here were not corrected with experimental measurements for potential systematic differences with actual factors, as in Ref. 50, potentially contributing to this artifact. Additionally, the cold spot may have been induced by time dependent changes in the positioning of individual events on the flood histogram, due to PMT signal baseline variations, that were not entirely corrected for by our postprocessing baseline restoration method. We do note, however, that RMSE measured across the axial and transaxial FOVs was only 3% greater, in both instances, with DbPET/CT than a commercial WB PET/CT.
The primary purpose of this study was to develop performance measurements, based on patient exams, to validate data correction schemes for DbPET/CT; however, these custom measurements could be used to guide the development of standard testing methods for bPET systems. Prior studies20, 22 have argued that the NEMA NU 4-2008 small animal23 and NU 2-2001 WB (Ref. 24) PET standards are not entirely applicable to bPET or PEM systems due largely to the use of phantoms with dimensions significantly different than those of the female breast and lack of accounting for OFOV activity. For instance, assessing corrections for count losses and randoms with NU 4-2008 and the right cylinder rat phantom (D = 5 cm), without modeling OFOV activity, may lead to an underestimation of both randoms and dead-time correction bias at a given injection activity (as estimated from activity in the phantom) as compared to conditions during patient scanning. This same phantom is used for SF estimation and as such may underestimate the contribution of scatter as well due to its significantly smaller diameter than the lower limit of general population pendant breast measurements (D = 10.1 cm). The custom test we used for estimating bias after randoms and dead-time corrections (see Sec. 2C2) modeled OFOV activity by acquiring data at the range of singles observed during patient imaging (which could be used to match correction bias at a given patient injection activity51), and although the phantom for this analysis was not used to compute SF, its diameter was within the range of female pendant breast measurements (D = 10.2 cm) and would likely provide a more realistic estimation of contribution from scatter than the NU 4-2008 rat phantom.
CONCLUSIONS
We have estimated the performance of data correction schemes for DbPET/CT with custom phantoms and methods based on patient imaging results. Spatial mispositioning of events due to pile-up was suspected of inducing both axial and transaxial nonuniformities as a function of singles count rates. Within the range of singles counts observed during patient imaging, residual error after applying all corrections was comparable to that of a commercial whole body PET/CT system. Our results have indicated that DbPET/CT can produce quantitative images, and the correction methods studied here will be used to assess the utility of bPET for monitoring therapy response in a clinical trial recently initiated at our institution.
ACKNOWLEDGMENTS
The authors thank Dr. Kai Yang and Dr. Michel Tohme for useful discussions, Felipe Godinez for technical assistance, Dr. Abhijit Chaudhari for useful discussion and manuscript preparation, and Dr. John Boone for use of equipment and facilities. Funding was provided in part by the Susan G. Komen for the Cure foundation (Grant No. BCT40707455), the National Institutes of Health (Grant No. NIH-NCI R01 CA129561), the National Institute of Biomedical Imaging and Bioengineering (Grant No. R01-EB002138), and the California Breast Cancer Research Program (Grant No. 11IB-0114).
References
- Rousseau C., Devillers A., Sagan C., Ferrer L., Bridji B., Campion L., Ricaud M., Bourbouloux E., Doutriaux I., Clouet M., Berton-Rigaud D., Bouriel C., Delecroix V., Garin E., Rouquette S., Resche I., Kerbrat P., Chatal J. F., and Campone M., “Monitoring of early response to neoadjuvant chemotherapy in stage II and III breast cancer by [F-18]fluorodeoxyglucose positron emission tomography,” J. Clin. Oncol. 24, 5366–5372 (2006). 10.1200/JCO.2006.05.7406 [DOI] [PubMed] [Google Scholar]
- Avril N., Bense S., Ziegler S. I., Dose J., Weber W., Laubenbacher C., Romer W., Jonicke F., and Schwaiger M., “Breast imaging with fluorine-18-FDG PET: Quantitative image analysis,” J. Nucl. Med. 38, 1186–1191 (1997). [PubMed] [Google Scholar]
- Kumar R., Loving V. A., Chauhan A., Zhuang H., Mitchell S., and Alavi A., “Potential of dual-time-point imaging to improve breast cancer diagnosis with 18F-FDG PET,” J. Nucl. Med. 46, 1819 (2005). [PubMed] [Google Scholar]
- Imbriaco M., Caprio M. G., Limite G., Pace L., De Falco T., Capuano E., and Salvatore M., “Dual-time-point 18F-FDG PET/CT versus dynamic breast MRI of suspicious breast lesions,” Am. J. Roentgenol. 191, 1323–1330 (2008). 10.2214/AJR.07.3439 [DOI] [PubMed] [Google Scholar]
- Wu Y., Bowen S. L., Yang K., Packard N., Fu L., G.Burkett, Jr., Qi J., Boone J. M., Cherry S. R., and Badawi R. D., “PET characteristics of a dedicated breast PET/CT scanner prototype,” Phys. Med. Biol. 54, 4273–4287 (2009). 10.1088/0031-9155/54/13/020 [DOI] [PMC free article] [PubMed] [Google Scholar]
- Raylman R., “Positron emission tomography-guided biopsy with a dedicated breast scanner: Initial evaluation,” IEEE Trans. Nucl. Sci. 56, 620–624 (2009). 10.1109/TNS.2009.2015449 [DOI] [Google Scholar]
- Tai Y. C., Wu H., Pal D., and O’sullivan J. A., “Virtual-pinhole PET,” J. Nucl. Med. 49, 471–479 (2008). 10.2967/jnumed.107.043034 [DOI] [PMC free article] [PubMed] [Google Scholar]
- Wang G. C., Huber J. S., Moses W. W., Qi J., and Choong W. S., “Characterization of the LBNL PEM camera,” IEEE Trans. Nucl. Sci. 53, 1129–1135 (2006). 10.1109/TNS.2006.874956 [DOI] [Google Scholar]
- Furuta M., Kitamura K., Ohi J., Tonami H., Yamada Y., Furumiya T., Satoh M., Tsuda T., Nakazawa M., Hashizume N., Yamakawa Y., Kawashima A., and Kumazawa Y., “Basic evaluation of a C-shaped breast PET scanner,” 2009 IEEE Nuclear Science Symposium Conference Record (IEEE, Orlando, Florida, 2009), pp. 2548–2552.
- Rosen E. L., Turkington T. G., Soo M. S., Baker J. A., and Coleman R. E., “Detection of primary breast carcinoma with a dedicated, large-field-of-view FDG PET mammography device: Initial experience,” Radiology 234, 527–534 (2005). 10.1148/radiol.2342040654 [DOI] [PubMed] [Google Scholar]
- Abreu M. C., Aguiar J. D., Almeida F. G., Almeida P., Bento P., Carrico B., Ferreira M., Ferreira N. C., Goncalves F., Leong C., Lopes F., Lousa P., Martins M. V., Matela N., Mendes P. R., Moura R., Nobre J., Oliveira N., Ortigao C., Peralta L., Pereira R., Rego J., Ribeiro R., Rodrigues P., Sampaio J., Santos A. I., Silva L., Silva J. C., Sousa P., Teixeira I. C., Teixeira J. P., Trindade A., and Varela J., “Design and evaluation of the Clear-PEM scanner for positron emission mammography,” IEEE Trans. Nucl. Sci. 53, 71–77 (2006). 10.1109/TNS.2006.870173 [DOI] [Google Scholar]
- Murthy K., Aznar M., Thompson C., Loutfi A., Lisbona R., and Gagnon J., “Results of preliminary clinical trials of the positron emission mammography system PEM-I: A dedicated breast imaging system producing glucose metabolic images using FDG,” J. Nucl. Med. 41, 1851–1858 (2000). [PubMed] [Google Scholar]
- Berg W. A., Weinberg I. N., Narayanan D., Lobrano M. E., Ross E., Amodei L., Tafra L., Adler L. P., Uddo J., Stein W., and Levine E. A., “High-resolution fluorodeoxyglucose positron emission tomography with compression (‘positron emission mammography’) is highly accurate in depicting primary breast cancer,” Breast J. 12, 309–323 (2006). 10.1111/j.1075-122X.2006.00269.x [DOI] [PubMed] [Google Scholar]
- Levine E. A., Freimanis R. I., Perrier N. D., Morton K., Lesko N. M., Bergman S., Geisinger K. R., Williams R. C., Sharpe C., Zavarzin V., Weinberg I. N., Stepanov P. Y., Beylin D., Lauckner K., Doss M., Lovelace J., and Adler L. P., “Positron emission mammography: Initial clinical results,” Ann. Surg. Oncol. 10, 86–91 (2003). 10.1245/ASO.2003.03.047 [DOI] [PubMed] [Google Scholar]
- Bowen S. L., Wu Y., Chaudhari A. J., Fu L., Packard N. J., Burkett G. W., Yang K., Lindfors K. K., Shelton D. K., Hagge R., Borowsky A. D., Martinez S. R., Qi J., Boone J. M., Cherry S. R., and Badawi R. D., “Initial characterization of a dedicated breast PET/CT scanner during human imaging,” J. Nucl. Med. 50, 1401–1408 (2009). 10.2967/jnumed.109.064428 [DOI] [PMC free article] [PubMed] [Google Scholar]
- Nakamoto Y., Ishizu K., Kanao S., Kawai K., and Togashi K., “Clinical imaging characteristics of the newly developed PET scanner for breast imaging,” J. Nucl. Med. 51, 1203 (2010). [Google Scholar]
- Raylman R., Abraham J., Hazard H., Koren C., Filburn S., Schreiman J., Kurian S., Majewski S., and Marano G., “Initial clinical test of a breast-PET scanner,” J. Med. Imaging Radiat. Oncol. 55, 58–64 (2011). 10.1111/j.1754-9485.2010.02230.x [DOI] [PMC free article] [PubMed] [Google Scholar]
- Raylman R. R., Majewski S., Wojcik R., Weisenberger A. G., Kross B., and Popov V., “Corrections for the effects of accidental coincidences, Compton scatter, and object size in positron emission mammography (PEM) imaging,” IEEE Trans. Nucl. Sci. 48, 913–923 (2001). 10.1109/23.940132 [DOI] [Google Scholar]
- Freifelder R., Cardi C., Grigoras I., Saffer J. R., Karp J. S., and Cardi C., “First results of a dedicated breast PET imager, BPET, using NaI(Tl) curve plate detectors,” 2001 IEEE Nuclear Science Symposium Conference Record (IEEE, San Diego, CA, 2001), Vol. 3, pp. 1241–1245.
- MacDonald L., Edwards J., Lewellen T., Haseley D., Rogers J., and Kinahan P., “Clinical imaging characteristics of the positron emission mammography camera: PEM Flex Solo II,” J. Nucl. Med. 50, 1666 (2009). 10.2967/jnumed.109.064345 [DOI] [PMC free article] [PubMed] [Google Scholar]
- Shkumat N. A., Springer A., Walker C. M., Rohren E. M., Yang W. T., Adrada B. E., Arribas E., Carkaci S., Chuang H. H., Santiago L., and Mawlawi O. R., “Investigating the limit of detectability of a positron emission mammography device: A phantom study,” Med. Phys. 38, 5176 (2011). 10.1118/1.3627149 [DOI] [PMC free article] [PubMed] [Google Scholar]
- Luo W., Anashkin E., and Matthews C. G., “Performance evaluation of a PEM scanner using the NEMA NU 4-2008 small animal PET standards,” IEEE Trans. Nucl. Sci. 57, 94–103 (2010). 10.1109/TNS.2009.2036847 [DOI] [Google Scholar]
- National Electrical Manufactures Association, NEMA Standards Publication NU 4-2008: Performance Measurements of Small Animal Positron Emission Tomographs (National Electrical Manufactures Association, Rosslyn, VA, 2008). [Google Scholar]
- National Electrical Manufactures Association, NEMA Standards Publication NU 2-2001: Performance Measurements of Positron Emission Tomographs (National Electrical Manufactures Association, Rosslyn, VA, 2001). [Google Scholar]
- Raylman R. R., Smith M. F., Kinahan P. E., and Majewski S., “Quantification of radiotracer uptake with a dedicated breast PET imaging system,” Med. Phys. 35, 4989–4997 (2008). 10.1118/1.2990781 [DOI] [PMC free article] [PubMed] [Google Scholar]
- Boone J. M., Shah N., and Nelson T. R., “A comprehensive analysis of DgN(CT) coefficients for pendant-geometry cone-beam breast computed tomography,” Med. Phys. 31, 226–235 (2004). 10.1118/1.1636571 [DOI] [PubMed] [Google Scholar]
- Boone J., Yang K., Burkett G., Packard N., Huang S., Bowen S., Badawi R., and Lindfors K., “An x-ray computed tomography/positron emission tomography system designed specifically for breast imaging,” Technol. Cancer Res. Treat. 9, 29–43 (2010). [DOI] [PMC free article] [PubMed] [Google Scholar]
- Harrison R. L., Vannoy S. D., Haynor D. R., Gillispie S. B., Kaplan M. S., and Lewellen T. K., “Preliminary experience with the photon history generator module of a public-domain simulation system for emission tomography,” 1993 IEEE Nuclear Science Symposium and Medical Imaging Conference Record (IEEE, San Francisco, CA, 1993), pp. 1154–1158.
- Doshi N. K., Silverman R. W., Shao Y., and Cherry S. R., “maxPET: A dedicated mammary and axillary region PET imaging system for breast cancer,” IEEE Trans. Nucl. Sci. 48, 811–815 (2001). 10.1109/23.940168 [DOI] [Google Scholar]
- Badawi R. D., Lodge M. A., and Marsden P. K., “Algorithms for calculating detector efficiency normalization coefficients for true coincidences in 3D PET,” Phys. Med. Biol. 43, 189–205 (1998). 10.1088/0031-9155/43/1/012 [DOI] [PubMed] [Google Scholar]
- Eriksson L., Wienhard K., and Dahlbom M., “A simple data loss model for positron camera systems,” IEEE Trans. Nucl. Sci. 41, 1566–1570 (1994). 10.1109/23.322950 [DOI] [Google Scholar]
- Kinahan P. E., Townsend D. W., Beyer T., and Sashin D., “Attenuation correction for a combined 3D PET/CT scanner,” Med. Phys. 25, 2046–2053 (1998). 10.1118/1.598392 [DOI] [PubMed] [Google Scholar]
- Siddon R. L., “Fast calculation of the exact radiological path for a 3-dimensional CT array,” Med. Phys. 12, 252–255 (1985). 10.1118/1.595715 [DOI] [PubMed] [Google Scholar]
- Defrise M., Kinahan P. E., Townsend D. W., Michel C., Sibomana M., and Newport D. F., “Exact and approximate rebinning algorithms for 3-D PET data,” IEEE Trans. Nucl. Sci. 16, 145–158 (1997). 10.1109/42.563660 [DOI] [PubMed] [Google Scholar]
- Grootoonk S., Spinks T. J., Sashin D., Spyrou N. M., and Jones T., “Correction for scatter in 3D brain PET using a dual energy window method,” Phys. Med. Biol. 41, 2757–2774 (1996). 10.1088/0031-9155/41/12/013 [DOI] [PubMed] [Google Scholar]
- Germano G. and Hoffman E., “A study of data loss and mispositioning due to pileup in 2-D detectors in PET,” IEEE Trans. Nucl. Sci. 37, 671–675 (1990). 10.1109/23.106696 [DOI] [Google Scholar]
- Kinahan P. E., Hasegawa B. H., and Beyer T., “X-ray-based attenuation correction for positron emission tomography/computed tomography scanners,” Semin. Nucl. Med. 33, 166–179 (2003). 10.1053/snuc.2003.127307 [DOI] [PubMed] [Google Scholar]
- Prionas N. D., Lindfors K. K., Ray S., Huang S., Beckett L. A., Monsky W. L., and Boone J. M., “Contrast-enhanced dedicated breast CT: Initial clinical experience1,” Radiology 256, 714–723 (2010). 10.1148/radiol.10092311 [DOI] [PMC free article] [PubMed] [Google Scholar]
- Antoch G., Freudenberg L. S., Egelhof T., Stattaus J., Jentzen W., Debatin J. F., and Bockisch A., “Focal tracer uptake: A potential artifact in contrast-enhanced dual-modality PET/CT scans,” J. Nucl. Med. 43, 1339 (2002). [PubMed] [Google Scholar]
- Huang S. C., Hoffman E. J., Phelps M. E., and Kuhl D. E., “Quantitation in positron emission computed-tomography: 2. Effect of inaccurate attenuation correction,” J. Comput. Assist. Tomogr. 3, 804–814 (1979). [PubMed] [Google Scholar]
- Schorn C., Fischer U., Doler W., Funke M., and Grabbe E., “Compression device to reduce motion artifacts at contrast-enhanced MR imaging in the breast,” Radiology 206, 279–282 (1998). [DOI] [PubMed] [Google Scholar]
- Zaidi H., “Comparative evaluation of scatter correction techniques in 3D positron emission tomography,” Eur. J. Nucl. Med. Mol. Imaging 27, 1813–1826 (2000). 10.1007/s002590000385 [DOI] [PubMed] [Google Scholar]
- Accorsi R., Adam L. E., Werner M. E., and Karp J. S., “Optimization of a fully 3D single scatter simulation algorithm for 3D PET,” Phys. Med. Biol. 49, 2577–2598 (2004). 10.1088/0031-9155/49/12/008 [DOI] [PubMed] [Google Scholar]
- Haynor D. R., Harrison R. L., and Lewellen T. K., “The use of importance sampling techniques to improve the efficiency of photon tracking in emission tomography simulations,” Med. Phys. 18, 990–1001 (1991). 10.1118/1.596615 [DOI] [PubMed] [Google Scholar]
- Cherry S. R. and Huang S. C., “Effects of scatter on model parameter estimates in 3D PET studies of the human brain,” IEEE Trans. Nucl. Sci. 42, 1174–1179 (1995). 10.1109/23.467730 [DOI] [Google Scholar]
- Qi J. and Huesman R. H., “Scatter correction for positron emission mammography,” Phys. Med. Biol. 47, 2759–2771 (2002). 10.1088/0031-9155/47/15/315 [DOI] [PubMed] [Google Scholar]
- Badawi R. D. and Marsden P. K., “Developments in component-based normalization for 3D PET,” Phys. Med. Biol. 44, 571–594 (1999). 10.1088/0031-9155/44/2/020 [DOI] [PubMed] [Google Scholar]
- Ollinger J. M., “Detector efficiency and Compton scatter in fully 3D PET,” IEEE Trans. Nucl. Sci. 42, 1168–1173 (1995). 10.1109/23.467731 [DOI] [Google Scholar]
- Conti M., Hamill J., and Luk W., “Component-based normalization for panel detector PET scanners,” IEEE Trans. Nucl. Sci. 51, 16–20 (2004). 10.1109/TNS.2003.823056 [DOI] [Google Scholar]
- Bai B., Li Q., Holdsworth C., Asma E., Tai Y., Chatziioannou A., and Leahy R., “Model-based normalization for iterative 3D PET image reconstruction,” Phys. Med. Biol. 47, 2773–2784 (2002). 10.1088/0031-9155/47/15/316 [DOI] [PubMed] [Google Scholar]
- Watson C. C., Casey M. E., Bendriem B., Carney J. P., Townsend D. W., Eberl S., Meikle S., and DiFilippo F. P., “Optimizing injected dose in clinical PET by accurately modeling the counting-rate response functions specific to individual patient scans,” J. Nucl. Med. 46, 1825–1834 (2005). [PubMed] [Google Scholar]


