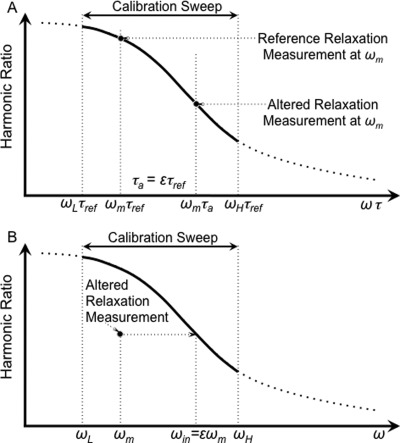
Figure 1.
The method estimating the relative relaxation time quantitatively. The MSB signal (a) as a function of the product of frequency and relaxation time, ωτ, and (b) as a function of frequency, ω. (a) The harmonic ratio for an ensemble of NPs over a range of ωτ. The harmonic ratio for reference NPs and NPs with altered relaxation both taken at one frequency, ωm, are shown for comparison. The altered relaxation time, τa, is ɛτref. (b) The calibration curve and the signal with the altered relaxation as a function of ω. The relative relaxation time, τa/τref = ɛ can be estimated as the scaling factor aligns the MSB signal for the altered relaxation with the reference curve.

