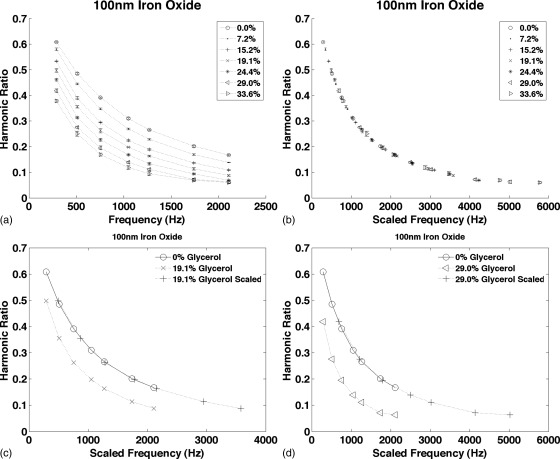
Figure 3.
The harmonic ratio from starch coated 100 nm iron oxide NPs measured at seven frequencies between 290 and 2110 Hz. (a) The signal from the same NPs was measured in PBS and as more glycerol was added to the sample to increase the viscosity. The curves for each glycerol concentration are shown. (b) The curves in (a) were scaled plotted as a function of ɛω to demonstrate that all the curves are scaled version of the same function. (c) The 19.1% glycerol curve plotted as a function of ω and ɛω compared to the 0% glycerol curve. (d) The 29% glycerol curve plotted as a function of ω and ɛω compared to the 0% glycerol curve. Each measurement was taken four times; the average is plotted and the error bars show the standard deviation.

