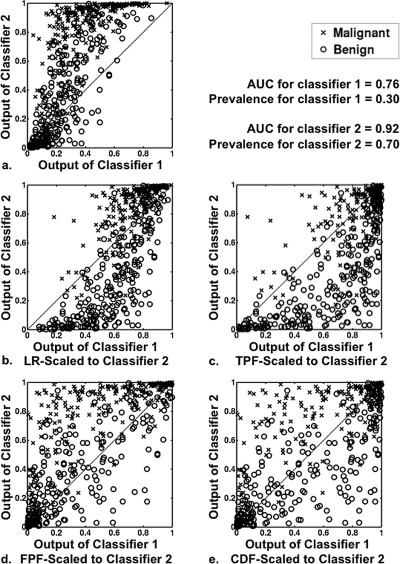
Figure 10.
Scatter plots showing effect of transforming the output of classifier 1 to the scale of classifier 2. Pairs of classifier outputs for 500 cases (250 malignant and 250 benign) were simulated from proper Bayesian bivariate distributions ( = 1.0, = 1.0, = 2.0, = 1.00, = = 0.8, PM-prevalence for classifier 1 = 0.30 and PM-prevalence for classifier 2 = 0.70). Panel (a): a scatter plot showing the outputs of classifiers 1 and 2 before scaling. Panels (b), (c), (d), and (e): scatter plots of the output of classifier 2 versus the scaled output of classifier 1 after each the four scaling transformations (LR, TPF, FPF, and CDF, respectively). Note that the rank order correlation of this sample is 0.81.

