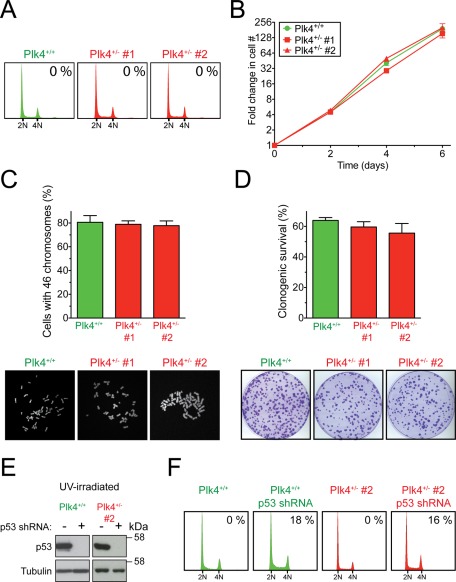
FIGURE 2:
Plk4+/– human cells do not undergo cytokinesis failure and show no increase in the level of centrosome amplification or aneuploidy. (A) Representative flow cytometry profiles of Plk4+/+ and Plk4+/− RPE1 cells. Numbers at the top right indicate the mean level of centrosome amplification from three independent experiments. (B) To monitor growth rate, Plk4+/+ and Plk4+/− RPE1 cells were counted every 2 d. Values represent the mean of two independent experiments, and error bars represent the SEM. (C) Graph shows the fraction of cells with 46 chromosomes in Plk4+/+ and Plk4+/− RPE1 cell lines. Bars represent the mean of >27 cells per condition from three independent experiments. Error bars represent the SEM. Immunofluorescence images show representative chromosome spreads from the indicated cell lines. (D) The percentage clonogenic survival for the Plk4+/+ and Plk4+/− RPE1 cell lines. Bars represent the mean of at least two independent experiments. Error bars represent the SEM. Images show representative crystal violet–stained colonies for the indicated cell lines. (E) Immunoblot of UV-irradiated Plk4+/+ and Plk4+/− RPE1 cells stably expressing a p53 shRNA. (F) Representative flow cytometry profiles of Plk4+/+ and Plk4+/− RPE1 cells stably expressing a p53 shRNA. Numbers at the top right indicate the mean level of centrosome amplification from two independent experiments.

