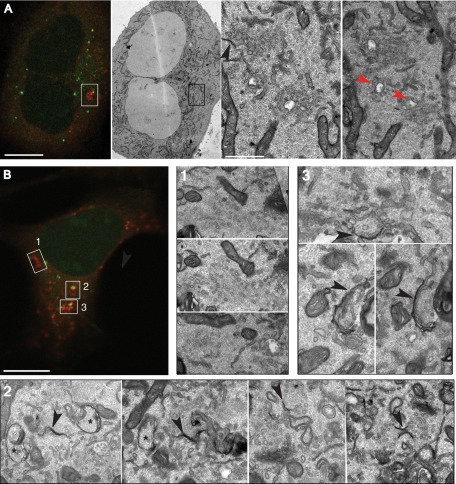
FIGURE 10:
CLEM analysis of mRFP-Atg9 in WIPI2-depleted GFP-DFCP1 cells. (A) CLEM of WIPI2-depleted starved or (B) RF starved cells. (A) Left, GFP-DFCP1/mRFP-Atg9–expressing cell. Right, boxed area in low-magnification image and two serial sections from this region. Red arrowheads indicate tubular and vacuolar Atg9-positive membranes. Black arrowhead indicates double-membrane phagophore. (B) Top left, confocal microscopy of mRFP-Atg9 and GFP-DFCP1–positive structures (boxes 1–3). These structures were then identified in low-magnification TEM and then in higher-magnification images, and sections from three different areas (1–3) are shown. Black arrowhead indicates double-membrane phagophores. Asterisk indicates autophagosome. Bars, 50 μm (A, B), 1 μm (A, middle panel).

