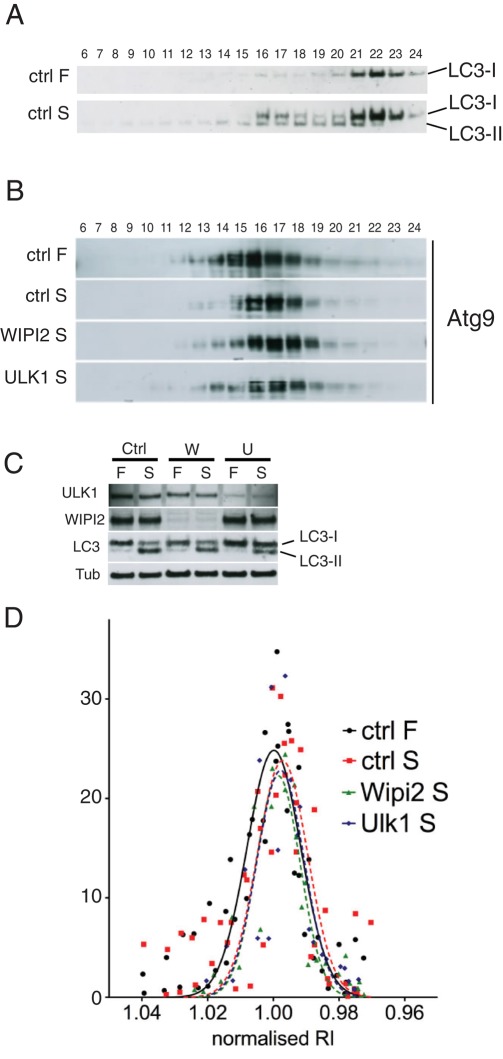
FIGURE 9:
The mAtg9 compartment is unaltered after starvation. (A) HEK293 cells were incubated in full (F) or starvation medium for 2 h (S) before homogenization and separation on a 1–22% Ficoll gradient as in Figure 6A. Fractions were loaded from left (heavy) to right (light) and analyzed by Western blot using an antibody against LC3. Membrane-associated LC3-II is found in fractions 13–21. (B) HEK293 cells were treated with RISC-Free (ctrl) siRNA or siRNA against WIPI2 or ULK1 and then incubated in full medium (F) or starved (S) for 2 h before homogenization and fractionation as in A, followed by Western blot for endogenous mAtg9. (C) The efficiency of the knockdown in B was evaluated using antibodies against ULK1, WIPI2, and β-tubulin and confirmed by inhibition of LC3 lipidation after both WIPI2 and ULK1 KD. (D) The intensity of mAtg9 signal was quantified (in arbitrary units) and plotted against the refractive index of each fraction (see example in Supplemental Figure S5D and Materials and Methods). To allow comparison of experiments, a Gaussian curve was fitted for each profile. For each experiment the values were normalized to the median value of the ctrl-F sample, and a Gaussian curve was fitted for each value. No significant shift from the median value was detected. Representative experiments are shown. Ctrl-F and ctrl-S, n = 4; WIPI2 and ULK1, n = 2.

