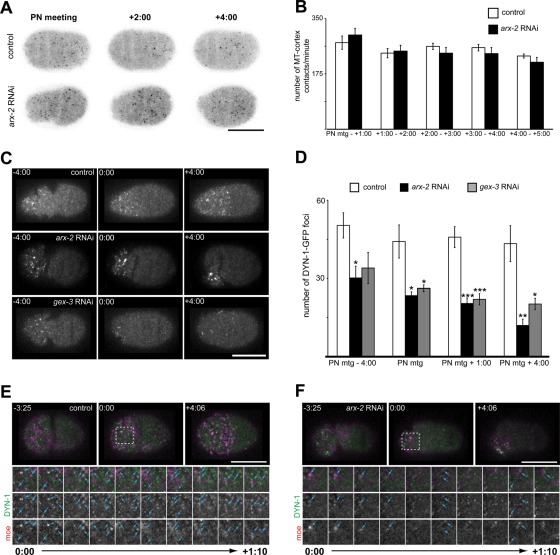
FIGURE 2:
ARX-2 affects endocytic protein organization but not microtubule contacts with cortex. (A) Single cortical focal plane of control and arx-2 RNAi-treated embryos expressing EBP-2–GFP. (B) Graph of the number of EBP-2–GFP foci detected at the cortex each minute. The number of foci at the cortex were counted every 5 s and summed to determine the number of contacts per minute. PN meeting to 1:00, p = 0.4395; 1:00–2:00, p = 0.8011; 2:00–3:00, p = 0.3159; 3:00–4:00, p = 0.4105; 4:00–5:00, p = 0.2760. n = 7 embryos for control and arx-2 RNAi-treated embryos at all time points. All p values calculated using Welch's t test. (C) Cortical projections of control and arx-2 RNAi- or gex-3 RNAi-treated embryos expressing DYN-1–GFP. (D) Quantification of the number of anterior cortical DYN-1–GFP foci in wild-type/control, arx-2, and gex-3 RNAi. arx-2 RNAi vs. control p values are as follows: PN meeting − 4:00, p = 0.014; PN meeting, p = 0.021; PN meeting + 1:00, p = 0.0006; PN meeting + 4:00, p = 0.0049. WT, n = 6 embryos; arx-2 RNAi, n = 5 embryos. gex-3 RNAi vs. control p values are as follows: PN meeting − 4:00, p = 0.0662; PN meeting, p = 0.036; PN meeting + 1:00, p = 0.00095; PN meeting + 4:00, p = 0.019. WT, n = 6 embryos; gex-3 RNAi, n = 5 embryos. Results are the mean ± SEM (E) Single cortical images of wild-type and (F) ARX-2–depleted embryos expressing DYN-1–GFP and moe-mCherry. Dotted box at 0:00 indicates the area highlighted for cropped time series (below). Blue arrowheads indicate examples of colocalized or partially colocalized DYN-1–GFP and moe-mCherry foci. Cropped images are images from every 10 s from PN meeting through 1:10 after PN meeting. For all images, times are in min:s and are relative to PN meeting, 0:00, which is the onset of the maintenance phase. For all graphs, asterisks indicate significance level: *p < 0.05, **p < 0.01, ***p < 0.001. Scale bar, 20 μm. See also Supplemental Figure S3 for arx-2 RNAi effects on clathrin localization.

