
FIGURE 10:
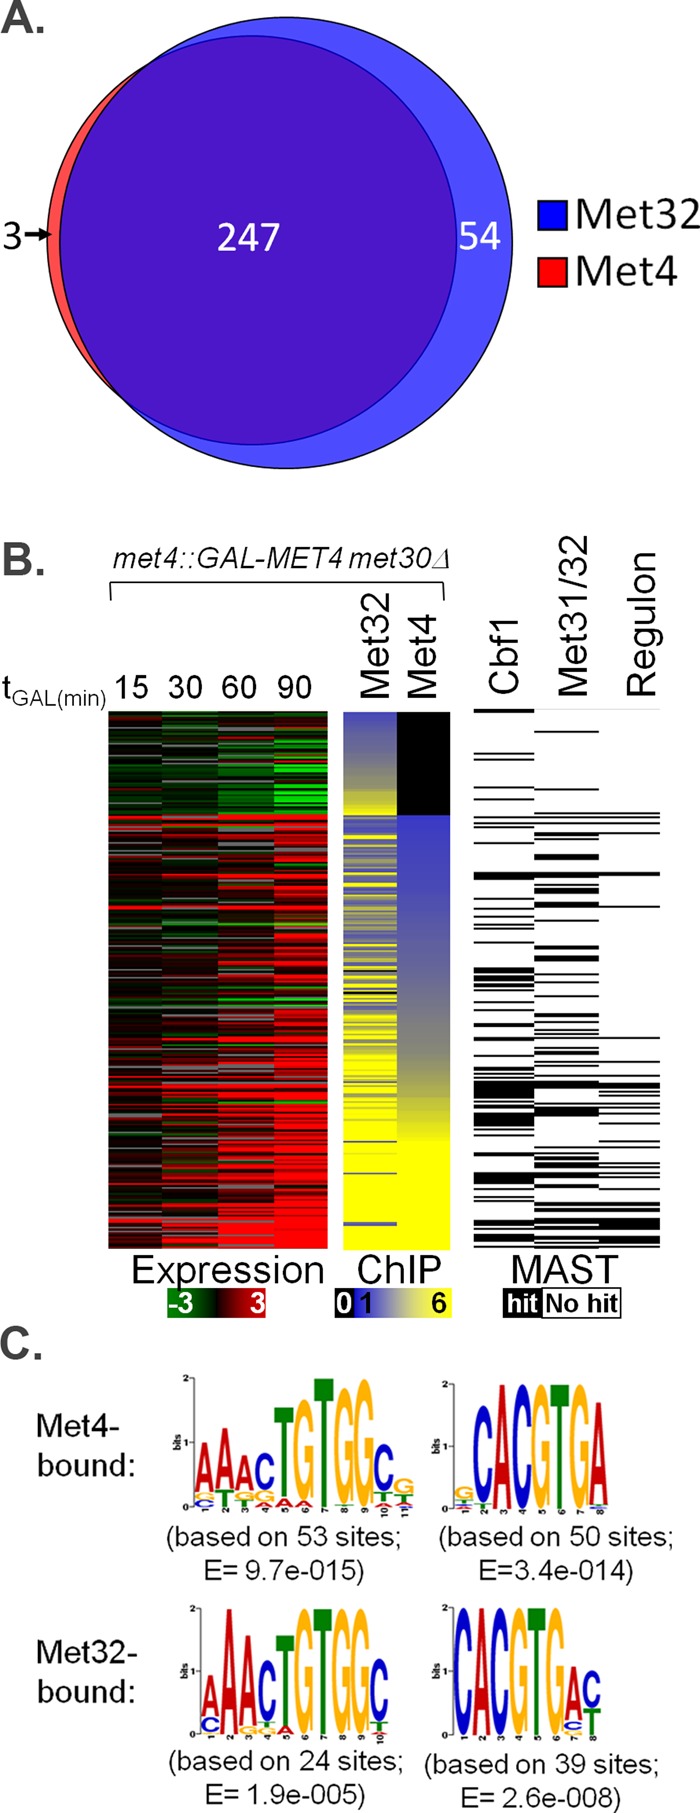
Characterization of in vivo genome binding for Met4 and Met32 using ChIP-chip. (A) Venn diagram of genome-wide Met4 and Met32 DNA targets upon active Met4 expression. Each circle represents the number of targets bound by Met4 (red circle) or Met32 (blue circle) as determined by analysis outlined in Materials and Methods. (B) ChIP-chip experiments (middle) are shown for Met4 and Met32 after 90 min of galactose induction. Each row represents a promoter region of a specific gene occupied by at least one factor. Expression profiles at different induction time points are shown for each gene (left). ChIP-chip data are presented on a yellow–blue enrichment scale (black indicates no binding), and gene expression data are presented on a green–red log2 scale (gray indicates unreliable measurements). Genes with MAST-determined matches to the Met4 core regulon–determined Met31/Met32 and Cbf1 motifs are marked by black boxes (right) (E value cutoff, 500; Bailey and Gribskov, 1998). (C) MEME-determined PSSMs of Met31/Met32- and Cbf1-binding motifs from the promoters that were most bound by Met4 and Met32 in ChIP-chip studies, respectively. Associated E values are listed.